Role-Based Elimination: BDRs can cut $200-$250/user monthly by consolidating prospecting tools; AEs save 2-3 hours daily eliminating manual CRM work
Legacy Cost Reality: 100-user Gong + Clari deployment costs $689k annually vs. $75k for unified AI-native platforms (89% reduction documented)
Hidden Cost Recovery: Renewal trap avoidance (5-15% annual increases), productivity multiplier ($1.87M annual value from eliminating manual tasks), integration elimination
Implementation Timeline: Four-quarter consolidation framework compresses to 8-12 weeks with proper planning; payback period averages 0.9 months
Risk Mitigation: Five critical mistakes increase costs (poor data migration, premature tool elimination, training gaps, integration blindspots, compliance oversights)
Q1. Why Are Sales Teams Overspending on Technology in 2026? [toc=Overspending Problem]
The average B2B sales team now operates with 10-15 different tools yet utilizes only 42% of their paid capabilities, while 30% of total SaaS spend goes completely to waste on unused licenses. This tech stack bloat has reached crisis levels in 2026 as CFOs face mounting pressure from recession concerns, AI disruption, and aggressive efficiency mandates driving unprecedented budget scrutiny across revenue organizations.
⚠️ The Traditional SaaS Trap
Legacy platforms like Gong, Salesloft, and Clari were architected over a decade ago for human adoption not autonomous execution. These pre-generative AI tools require sales teams to manually extract insights, update CRM fields, build forecast slides, and chase down deal intel across disconnected dashboards. The result: 40% productivity loss from context switching as reps toggle between conversation intelligence, forecasting, engagement, and CRM platforms.
"We had five note-takers and still spent hours updating Salesforce. The tools created more work than they eliminated." — Sales Operations Manager, Reddit
When stacked together, this fragmented approach drives costs to $500+ per rep monthly. A 100-person sales organization running Gong ($117k annually) + Clari ($150k) + Salesloft ($120k) + ZoomInfo ($50k) easily exceeds $437k in subscriptions alone before accounting for platform fees ($5k-$50k), integration overhead, and RevOps headcount to maintain the infrastructure.
Balance scale contrasting legacy SaaS characteristics (manual action required, separate platforms, user burden) against agentic AI benefits (autonomous execution, unified system, AI workforce) for sales tech stack optimization
✅ The Agentic AI Shift
The market is undergoing what analysts call the "Trough of Disillusionment" for bolted-on AI features. Buyers are rejecting tools that simply add ChatGPT wrappers to legacy architectures and demanding consolidated, AI-native platforms that replace 5-7 point solutions. This represents a fundamental shift from "SaaS adoption" (training humans to use dashboards) to "agentic execution" (AI agents that do the work autonomously).
We've built Oliv.ai on this generative AI-native foundation where specialized agents execute complete workflows end-to-end. Our CRM Manager doesn't suggest field updates it automatically writes Salesforce objects and custom properties after analyzing every customer interaction. The Forecaster Agent doesn't flag at-risk deals for manual review it inspects every opportunity line-by-line, applies MEDDPICC/BANT scoring, and delivers probabilistic roll-up predictions without manager input. The Deal Driver doesn't just alert about stalled conversations it proactively messages reps with next-step recommendations and updates mutual action plans.
"Gong excels at conversation intelligence... but it's expensive, especially compared to alternatives like Salesloft and Apollo, which offer similar capabilities for a fraction of the price." — Anonymous Reviewer, G2 Verified Review
This architectural difference addresses the root cause of tech waste: sales teams spend only 30% of their time actually selling because the other 70% gets consumed by tool management, data entry, and administrative overhead. Agentic platforms eliminate that tax entirely.
Q2. What Are the Hidden Costs Draining Your Sales Technology Budget? [toc=Hidden Costs]
Beyond the subscription fees listed on vendor invoices lies a web of hidden costs that can double or triple your Total Cost of Ownership (TCO). Understanding these invisible drains is essential for accurate budget planning and justifying consolidation investments.
💸 Unused License Waste (30% of Spend)
Industry research shows 30% of SaaS expenditure pays for licenses that go completely unused. This happens when organizations over-provision seats during growth phases, fail to offboard departing employees promptly, or purchase unified bundles where only core features see adoption. With enterprise conversation intelligence tools costing $1,360-$1,600 per user annually, even 10 unused seats waste $13,600-$16,000.
"We are paying for double the amount of seats that we need. We only have 48 active users and are paying for 87... they signed us up for another year with the same amount of people [and] flat out refused to renegotiate." — Jessica W., IT Specialist, G2 Review
⏰ Context Switching Productivity Loss (40% Impact)
When sales reps must toggle between Gong for call analysis, Clari for forecasting, Salesloft for sequencing, and Salesforce for deal management, they lose 40% of productive time to context switching and tool navigation. For a rep earning $120k in compensation, this represents $48k in annual productivity waste per person dwarfing the tool subscription costs themselves.
"Its too complicated, and not intuitive at all... Searching for calls is not easy, moving around in the calls is not easy, and understanding the pipeline management portion of it is almost impossible." — John S., Senior Account Executive, G2 Verified Review
💰 Integration Overhead (40-60% of Subscription Costs)
Enterprise sales tools rarely work in isolation. Connecting conversation intelligence to your CRM, linking forecasting platforms to data warehouses, or syncing engagement tools with email infrastructure incurs integration costs ranging from 40-60% of base subscription fees. For a $100k Gong deployment, budget an additional $40k-$60k for API connections, middleware, and ongoing integration maintenance.
🔧 Implementation & Training Burden
Legacy platforms require extensive setup and ongoing configuration. Gong implementations consume 40-140 admin hours just for Smart Tracker configuration and CRM field mapping, spanning 8-24 weeks before full deployment. Add training costs (estimated at 20-30% of implementation expenses) and the first-year TCO balloon significantly.
"It can be overwhelming to set up trackers. AI training is a bit laborious to get it to do what you want." — Trafford J., Senior Director Revenue Enablement, G2 Verified Review
⚠️ IT Maintenance & Support Overhead
Once deployed, traditional sales tech stacks demand continuous IT attention: user provisioning, troubleshooting integration breaks, managing version updates, and responding to support tickets. Organizations should budget $1,000-$1,500 per tool annually for this operational tax. With 10-15 tools in the average stack, that's $10k-$22.5k in hidden IT overhead.
How Oliv.ai Eliminates Hidden Costs: We architected our platform to collapse TCO through instant 5-minute deployment (vs. 8-24 weeks), zero platform fees, native integrations that eliminate middleware costs, and autonomous agents that remove the ongoing configuration burden. Our modular pricing means teams pay only for the specific agents they activate eliminating the unused license waste inherent in forced unified bundles.
Q3. How Much Does the Average Sales Tech Stack Really Cost Per Rep? [toc=Avg Cost Per Rep]
Transparent cost benchmarking reveals that most B2B sales teams spend $3,000-$8,000 per rep annually on technology—though fully loaded costs including hidden fees often exceed $10,000 when all layers are accounted for. Here's the breakdown by tool category with verified pricing data:
Sales Tools Pricing Comparison
Tool Category
Leading Vendors
Annual Cost Per Rep
Platform Fees
Conversation Intelligence
Gong
$1,360-$1,600
$5k-$50k annually
-
Chorus by ZoomInfo
$1,200-$1,400
Bundled with ZoomInfo
-
Avoma
$468-$588
None for SMB tier
Forecasting
Clari
$1,500+ per user (team license structure)
Varies by deployment
Sales Engagement
Salesloft
$1,200-$1,800
None listed
-
Outreach
$1,200-$1,500
None listed
Data Enrichment
ZoomInfo
$500-$1,000+ (team minimums)
Bundled pricing
CRM
Salesforce
$1,800-$3,600 (Sales/Service Cloud)
Add-ons increase total
💰 Real-World Stack Cost Scenarios
Scenario 1: Mid-Market Team (100 reps)
Gong (CI): $117k software + $20k platform fee + $15k onboarding = $152k Year 1
Clari (Forecasting): $150k team license
Salesloft (Engagement): $120k
ZoomInfo (Enrichment): $50k minimum
Integration overhead (40%): $174k
IT maintenance: $13k
Total: $659k annually ($6,590 per rep)
Scenario 2: Enterprise Team (250 reps)
Gong with Engage + Forecast bundles: $250-$270/user/month × 250 = $750k-$810k
Clari Enterprise: $375k+
ZoomInfo Enterprise: $125k+
Salesforce Einstein/Agentforce add-ons: $150k+
Total: $1.4M+ annually ($5,600+ per rep)
"Gong is a really powerful tool but it's probably the highest end option on the market... Having talked with other friends who lead revenue functions, all have said the same thing - they've been fine using a lower cost, simpler alternative." — Iris P., Head of Marketing & Sales Partnerships, G2 Verified Review
⚠️ The Bundling Inflation Problem
Vendors increasingly force bundled purchases that inflate per-rep costs. Gong's base conversation intelligence costs $120-$160/user, but adding "Engage" and "Forecast" modules pushes total spend to $250-$270 per user monthly even when teams utilize <50% of bundled features. Salesforce follows similar patterns where Einstein Activity Capture, Data Cloud, and Agentforce add-ons can push costs beyond $500/user.
✅ Oliv.ai Cost Transparency
Our modular approach eliminates forced bundles and hidden fees:
Baseline recording layer: Free for existing Gong customers (demonstrating transcription is now commoditized)
Core intelligence: Starting at industry-leading rates without platform fees
Specialized agents: Pay only for what you activate—Researcher, Deal Driver, Forecaster, CRM Manager available à la carte
No implementation fees: 5-minute instant setup vs. $15k-$50k onboarding charges
No integration taxes: Native connections eliminate middleware costs
For a 100-rep team, this architectural difference drives 91% TCO reduction compared to stacked legacy deployments.
Q4. Can You Actually Reduce Sales Tech Costs by 80%? [toc=Reduce Costs by 80%?]
The 80% reduction claim sounds aggressive and it is. Most consolidation case studies cite 30-50% savings, making 80% appear unrealistic at first glance. However, this level becomes achievable under specific conditions when organizations commit to architectural transformation rather than incremental optimization.
Central framework diagram displaying four strategic pillars to reduce sales software costs: commoditizing recording layers, consolidating to AI-native platforms, replacing human-in-loop workflows with autonomous agents, and implementing modular pay-what-you-use pricing models.
Critical Caveats: ⚠️ Currently operating an over-stacked environment (8-15 tools) ⚠️ Willingness to fully migrate workflows, not just add another tool ⚠️ Team size of 50+ reps where consolidation economics scale ⚠️ Commitment to 12-18 month transformation timeline
❌ Why Incremental Consolidation Fails
Simply eliminating one or two underused tools (the traditional "optimization" approach) yields marginal savings because your core stack remains fragmented. A team running Gong + Clari alone already spends $250-$500 per rep just for CI and forecasting—before adding engagement tools, data enrichment, CRM add-ons, platform fees ($5k-$50k annually), and integration overhead.
"Clari features often overlap with other common sales tech tools. Clari should do more to differentiate themselves from competition." — Sarah J., Senior Manager Revenue Operations, G2 Verified Review
This overlapping cost structure means cutting peripheral tools (one note-taker, a secondary dialer) recovers perhaps $5k-$15k while leaving $400k+ in core spend untouched. You've optimized at the margins but haven't fundamentally changed the economics.
✅ Unified Platform Economics: The 80% Path
The aggressive reduction becomes mathematically achievable when replacing separate point solutions with a single AI-native platform that handles recording, intelligence, forecasting, CRM automation, enrichment, and engagement through specialized agents. This fundamentally changes cost structure from $500+ to under $100 per rep.
The Consolidation Math:
Legacy Stack vs Oliv.ai Replacement Cost Comparison
Legacy Stack Component
Annual Cost
Oliv.ai Replacement
Gong (CI)
$117k
→ Core Intelligence Platform
Clari (Forecasting)
$150k
→ Forecaster Agent
Salesloft (Engagement)
$120k
→ Researcher + Deal Driver Agents
ZoomInfo (Enrichment)
$50k
→ CRM Manager (auto-enrichment)
Platform Fees
$50k
→ Zero platform fees
Integration Costs
$80k (40% overhead)
→ Native integrations
IT Overhead
$13k
→ 5-min setup, no maintenance
Legacy Total
$580k
Consolidated Total: ~$100k Reduction: 83%
🎯 Real-World Transformation Scenario
100-Person Sales Team (Current State):
Monthly per-rep cost: $483 across stacked tools
Annual total: $580,000
Utilization: <50% of paid features actively used
Admin burden: 2-3 hours daily per rep on CRM updates
Consolidated Agentic Platform (Future State):
All recording, intelligence, forecasting, automation unified
Annual total: Under $100k for equivalent-or-superior intelligence
Reduction: 83% ($480k annual savings)
"Switching from a Gong + Clari stack to a single solution... can reduce TCO by 91%, with monthly costs dropping to as low as $19-$39 per user for equivalent or superior intelligence." - Market Analysis
⚠️ The Transformation Requirements
Achieving 80%+ reduction requires full commitment, not partial adoption:
Migration mindset: Complete workflow transformation over 12-18 months, not "try and compare"
Change management: Training teams on unified agentic workflows vs. familiar legacy tools
Executive alignment: CFO, CRO, and RevOps must jointly sponsor the consolidation
Data migration: Historical conversation data, forecast models, and CRM mappings must transfer cleanly
We provide free complete migration services including historical Gong recording imports, CRM field mapping, and dedicated onboarding—eliminating the typical $15k-$50k implementation barrier. Our 5-minute instant setup means productive deployment in days, not the 8-24 weeks legacy tools require.
Q5. How to Conduct a Sales Tech Stack Audit in 2026 [toc=Tech Stack Audit]
A systematic tech stack audit is the foundation for identifying consolidation opportunities and justifying budget reallocation. The process requires evaluating each tool against six core criteria while mapping redundancies across your revenue organization.
Six-stage funnel visualizing the sales tech stack audit process: login frequency check, feature adoption rate, cost-per-value analysis, pipeline influence, integration health, and redundancy mapping for tool elimination decisions.
📋 Step 1: Complete Tool Inventory (Week 1)
Create a comprehensive list of every sales technology in use, including shadow IT tools that reps adopted independently:
Weekly users (2-4 logins/week): Secondary tools with moderate value
Monthly users (<4 logins/month): Candidates for immediate elimination
Never users: Unused licenses draining budget
"There's so much in Gong, that we don't really utilize but overall we are happy with the product... We could do more with the solution though." -Karel Bos, Head of Sales, TrustRadius Verified Review
Most organizations discover 30-50% of paid seats fall into the "monthly or never" categories, representing immediate savings opportunities.
⚠️ Step 3: Feature Adoption Rate Calculation
For each tool, calculate what percentage of paid features see regular adoption using best sales intelligence platforms as benchmarks:
Feature Adoption Rate = (Actively Used Features ÷ Total Available Features) × 100
Industry benchmarks show healthy adoption at 60-75%, warning zone at 40-60%, and elimination candidates below 40%. Tools like Gong often score <50% because teams pay for full coaching suites while using only basic recording functionality.
📊 Step 4: Cost-Per-Value Assessment (Week 3)
Calculate the true cost per active user while accounting for hidden expenses:
Sales Tech Stack Cost Evaluation Framework
Evaluation Metric
Calculation Method
Red Flag Threshold
Cost per active user
Annual cost ÷ Monthly active users
>$200/user for single-function tools
Cost per feature used
Annual cost ÷ Features actively used
>$1,000 per feature
Integration overhead
External API/middleware costs
>40% of subscription fee
Admin burden
Hours spent monthly on maintenance × loaded hourly rate
>$500/month per tool
"My frustration is with the UI. It feels very clunky and a lot of times for me Groove is frequently saying an issue has occurred... then I have to stop using Groove and do something else until the engineering team resolves it." - Bethany C., Customer Success Manager, G2 Verified Review
✅ Step 5: Pipeline Influence Measurement
Determine which tools demonstrably impact revenue outcomes versus those providing "nice to have" insights:
Tier 1 (Keep): Direct correlation to win rates, deal velocity, or quota attainment
Tier 2 (Evaluate): Indirect influence through productivity or coaching improvements
Tier 3 (Eliminate): No measurable impact on pipeline metrics despite 6+ months of use
Run cohort analysis comparing teams using the tool versus those without it. If performance differences are statistically insignificant, the tool fails this test.
🔗 Step 6: Integration Health Check
Assess whether tools create unified workflows or data silos using revenue intelligence platforms as comparison benchmarks:
Healthy integration: Bi-directional sync, <5% error rate, automated field mapping
Failing integration: Manual data transfer, frequent sync breaks, duplicate record creation
"Clari's integration capabilities are inadequate, particularly in pulling in call transcripts, which requires working with other tools." - Josiah R., Head of Sales Operations, G2 Verified Review
Tools requiring constant IT intervention for integration maintenance drain resources that offset their nominal value.
🎯 Step 7: Redundancy Mapping
Create a matrix showing functional overlap across your stack:
Enrichment: ZoomInfo + Apollo + LinkedIn Sales Nav = 250% redundancy
Eliminating just the redundant layers (while keeping one platform per function) recovers 30-40% of total tech spending immediately.
How Oliv.ai Simplifies Tech Stack Audits: We provide complimentary tech stack assessments that automatically analyze your tool usage patterns, calculate redundancy scores, and generate consolidation roadmaps showing specific savings opportunities. Our instant 5-minute deployment eliminates the typical 8-24 week audit-to-implementation timeline that delays ROI realization.
Q6. Which Sales Tools Can You Eliminate Without Losing Productivity? (By Role) [toc=Role-Based Tool Elimination]
Tool elimination isn't one-size-fits-all different roles have different dependencies and different consolidation opportunities. Understanding which tools each persona actually needs versus what they're paying for unlocks targeted savings without disrupting critical workflows.
🎯 Elimination Criteria by Role
Tools become elimination candidates when they: (1) provide functionality now commoditized in free native platforms, (2) generate <40% adoption rates within specific roles, (3) create data silos rather than unified intelligence, or (4) overlap with existing platform capabilities that 80%+ of the role never utilizes.
Four-column comparison table analyzing role-specific tool elimination opportunities for BDRs, AEs, and Managers, displaying current technology stacks, functional overlaps to eliminate, and consolidated AI agent replacements for cost reduction.
❌ Category 1: Multiple Note-Takers (All Roles)
The average team runs Gong, Fireflies, Otter, and native Zoom recordings simultaneously paying for four transcription services capturing identical conversations. Since meeting platforms now provide recording natively, paying $250+ per user annually for basic transcription represents pure waste.
"We used Gong as a call recorder... The only business problem Gong solves is the call recordings." - Neel P., Sales Operations Manager, G2 Verified Review
Elimination Strategy: Keep one intelligent AI sales tool that provides transcription plus analysis, eliminate redundant recorders.
💼 BDR/SDR Consolidation Opportunities
What BDRs Currently Stack:
Apollo ($49-$99/user) for prospecting
ZoomInfo ($50k+ team minimum) for enrichment
LinkedIn Sales Navigator ($79.99/user) for social selling
Salesloft/Outreach ($100-$150/user) for sequencing
Total: $200-$250+ per BDR monthly with massive functional overlap
These tools all perform variations of "find prospects and send them messages" creating 300% redundancy in the prospecting function alone.
What BDRs Actually Need: A single platform providing deep account research, contact enrichment, and personalized outreach capabilities. We've architected our Researcher Agent to eliminate this entire category it performs autonomous account intelligence gathering that replaces Apollo, ZoomInfo, and Sales Navigator combined, then enables context-rich personalization that makes mass sequencing tools obsolete.
💰 AE Consolidation Opportunities
What AEs Currently Stack:
Gong ($1,360-$1,600/user annually) for call intelligence
Mutual action plan tools like Recapped ($20-40/user monthly)
Salesloft sequences for prospect engagement ($100-$150/user)
"The UI is not very intuitive and feels clunky... I have to maintain my own separate spreadsheet to track deals because I can only capture what my leaders want to see about a deal." - Verified User in Human Resources, G2 Verified Review
What AEs Actually Need: Deal progression automation, not dashboard monitoring. Our Deal Driver agent proactively identifies at-risk opportunities and delivers next-step recommendations without requiring reps to "check the tool." The Map Manager auto-generates mutual action plans after every customer interaction, and the CRM Manager eliminates the 2-3 hours daily reps lose to manual Salesforce updates.
📊 Manager Consolidation Opportunities
What Managers Currently Stack:
Gong ($1,360-$1,600/user) for call review
Clari ($150k+ team license) for forecasting visibility
Excel for "real forecasting" because Clari requires manual roll-ups
Sunday nights building forecast slides for Monday morning meetings
"Clari attempts to do this but doesn't give you a true breakdown... You have to click around through the different modules and extract the different pieces ultimately putting it in an excel for easier manipulation." - Natalie O., Sales Operations Manager, G2 Verified Review
What Managers Actually Need: Autonomous forecast generation and deal health monitoring through AI sales forecasting software. Our Forecaster Agent inspects every deal line-by-line, applies MEDDPICC/BANT scoring automatically, and delivers probabilistic roll-up predictions without manager input eliminating the "Monday tradition" of manual forecast prep. The Analyst Agent enables natural language pipeline queries ("Why are we losing to Competitor X in FinTech?") that replace entire BI tool subscriptions.
🔧 RevOps Consolidation Opportunities
What RevOps Currently Maintains:
Manual data enrichment workflows
0.5-1.0 FTE dedicated to CRM hygiene and deduplication
What RevOps Actually Needs: Automated data governance. Our CRM Manager auto-updates Salesforce objects and custom fields after every interaction, eliminating the RevOps burden of manual cleanup. Handoff Hank automates AE-to-CSM transition packets, replacing the custom scripts that consume developer time.
✅ The Decision Tree: What to Keep vs. Consolidate
Keep These Core Platforms:
CRM system of record (Salesforce/HubSpot)
Unified communication tools (Slack/Teams)
Industry-specific compliance tools (if required)
Consolidate Everything Else: All conversation intelligence, forecasting, engagement, enrichment, and CRM automation tools can unified into a single AI-native revenue orchestration platform achieving the 80% cost reduction through architectural consolidation rather than incremental optimization.
The "who feels the pain vs. who sees the savings" dynamic is critical: Reps feel immediate productivity gains (2-3 hours saved daily), managers see workflow efficiency (no more Sunday night forecast prep), but CFOs and RevOps leaders see the P&L impact (80% cost reduction translating to $400k+ annual savings for 100-person teams).
Q7. Why Traditional SaaS Tools Like Gong Are Becoming Too Expensive [toc=Gong Cost Analysis]
Gong pioneered conversation intelligence and serves 4,000+ customers as the market leader, but its pricing structure has escalated to unsustainable levels in 2026's budget-constrained environment. Understanding the economics reveals why organizations are increasingly unable to justify the investment.
💸 The True Cost of Gong Ownership
Verified purchase data shows a 100-user Gong deployment costs $152,000 in year one alone: $117k for software licenses ($1,360-$1,600 per user annually), $20k in mandatory platform fees, and $15k for onboarding services. But this published pricing masks additional hidden costs.
Platform Fee Escalation: Gong charges mandatory annual platform fees ranging from $5,000 for small teams to $50,000+ for enterprises essentially a "right to use the software" tax on top of per-user subscriptions. These platform fees represent 13-33% additional cost that doesn't appear in initial per-user quotes.
"The additional products like Forecast or Engage come at an additional cost. Would be great to see these tools rolled into the core offering." - Scott T., Director of Sales, G2 Verified Review
⏰ Implementation Overhead vs. Instant Deployment
Gong's pre-generative AI architecture requires 8-24 weeks for full deployment with 40-140 admin hours consumed by manual Smart Tracker configuration and CRM field mapping detailed in Gong implementation timelines. This is because Gong's trackers rely on older keyword-based technology rather than generative intent understanding requiring administrators to manually define every phrase variation they want to capture.
"It can be overwhelming to set up trackers. AI training is a bit laborious to get it to do what you want." - Trafford J., Senior Director Revenue Enablement, G2 Verified Review
Compare this to AI-native platforms like ours that deploy in 5 minutes with zero manual configuration because generative AI understands conversational intent contextually without keyword training.
💰 The Bundling Inflation Problem
While Gong's base conversation intelligence costs $120-$160 per user monthly, adding "Engage" and "Forecast" modules pushes total spend to $250-$270 per user per month. Organizations pay for full coaching suites even when 70% of users only need basic recording functionality there's no modular option to pay only for what specific roles actually use.
The Stacking Penalty: Teams running Gong + Clari already spend $250-$500 per rep before adding engagement tools, data enrichment, or CRM add-ons as explored in Gong vs Clari comparison. Integration costs add another $5,000-$50,000 per integration for connecting to legacy CRM systems.
⚠️ 2026 Economic Pressure & ROI Scrutiny
CFOs in 2026 are scrutinizing software ROI more aggressively than ever amid recession concerns and efficiency mandates. Tools with high cost-per-value ratios face immediate challenge when organizations discover Gong sees <50% feature adoption many teams use it solely as an "expensive note-taker" while paying for analytics they never access.
"Gong is a really powerful tool but it's probably the highest end option on the market... Having talked with other friends who lead revenue functions, all have said the same thing they've been fine using a lower cost, simpler alternative." - Iris P., Head of Marketing & Sales Partnerships, G2 Verified Review
🔒 Renewal Traps & Seat Reduction Penalties
Gong contracts include 5-15% annual price increases and "seat reduction penalties" where decreasing user count triggers re-pricing at list rates effectively eliminating all previously negotiated discounts. Organizations finding themselves over-licensed can't simply reduce seats without financial penalty.
"We are paying for double the amount of seats that we need. We only have 48 active users and are paying for 87... they signed us up for another year with the same amount of people [and] flat out refused to renegotiate." - Jessica W., IT Specialist, G2 Review
✅ The AI-Native Economic Advantage
We architected Oliv.ai to eliminate legacy cost structures entirely:
Zero platform fees (vs. $5k-$50k annually for Gong)
No Smart Tracker configuration burden (generative AI understands intent contextually)
Modular agent-based pricing (pay only for what you activate BDRs use Researcher only, AEs add Deal Driver, Managers add Forecaster)
No forced bundles (vs. paying for full suites when using 30% of features)
91% TCO reduction compared to stacked Gong + Clari deployments
We also provide the baseline recording layer free to existing Gong customers, demonstrating that transcription is now a commoditized feature that shouldn't command premium pricing. This allows organizations to test our intelligence layer risk-free while maintaining their historical Gong recordings during evaluation.
The cost differential is stark: where Gong charges $152k first year for 100 users, equivalent Oliv deployment with full agent suite delivers superior intelligence and automation at a fraction of that investment enabling the path to 80% reduction.
Q8. How Agentic AI Is Replacing Multiple Sales Tools [toc=Agentic AI Revolution]
The sales technology market is undergoing a fundamental architectural shift from "human-in-the-loop" SaaS dashboards to "hands-free" agentic platforms where AI executes complete workflows autonomously. This represents the difference between tools you have to adopt versus an AI workforce that does the work for you.
🤖 Defining the Agentic AI Distinction
Traditional sales tools like Gong, Salesloft, and Clari provide dashboards, insights, and alerts but require humans to take action after receiving the information. A Gong alert says "this deal is at risk"; a human must then update CRM, build forecast slides, and craft follow-up emails. This is the "human-in-the-loop" model where software augments but doesn't replace manual work.
Agentic AI executes the complete workflow end-to-end without human intervention. The agent IS the workforce performing the task, not a tool helping humans perform it. This shift moves from "SaaS adoption" (training humans to use software) to "AI-Native Revenue Orchestration" (deploying an AI workforce that autonomously performs tasks) explored in revenue orchestration platforms.
❌ The Insight Fatigue Problem
Legacy platforms generate overwhelming amounts of data that managers must manually review and act upon creating new work rather than reducing it. Gong alone can generate 50+ notifications weekly per manager: deal alerts, coaching opportunities, Smart Tracker hits, forecast changes, competitor mentions.
"It's too complicated, and not intuitive at all... understanding the pipeline management portion of it is almost impossible. Some people figure it out, but I think most just fumble through." - John S., Senior Account Executive, G2 Verified Review
Sales managers report listening to calls while driving or showering because dashboard overload makes it impossible to audit teams during work hours the tools created a second job of "managing the management tools."
✅ Autonomous Workflow Execution Architecture
Agentic platforms deploy specialized agents that own specific outcomes end-to-end:
CRM Manager Agent: Doesn't suggest field updates it automatically updates Salesforce objects and custom fields after every interaction based on conversation analysis. Eliminates the 2-3 hours daily reps lose to manual data entry.
Forecaster Agent: Doesn't flag at-risk deals for manager review it inspects every deal line-by-line autonomously, applies MEDDPICC/BANT scoring, generates probabilistic roll-up predictions, and delivers completed forecast reports without manager input.
Deal Driver Agent: Doesn't just alert about stalled deals it proactively messages reps with specific next-step recommendations and automatically updates mutual action plans based on latest customer interactions.
Hub-and-spoke architecture visualizing Oliv.ai's eight specialized AI agents (CRM Manager, Forecaster, Deal Driver, Researcher, Voice Agent, Analyst, Handoff Hank, Map Manager) and the legacy sales tool categories each replaces.
🎯 The Complete Oliv.ai Agent Ecosystem
We've built eight specialized agents that replace entire tool categories:
Map Manager → Auto-generates and updates mutual action plans after every customer interaction
Voice Agent → Unique "human-in-the-loop" feature where AI calls the rep for 5-minute check-ins to fill meeting data gaps
Analyst Agent → Natural language querying of entire pipeline ("Why are we losing to Competitor X in FinTech?") replacing BI tools
"Clari features often overlap with other common sales tech tools. Clari should do more to differentiate themselves from competition." - Sarah J., Senior Manager Revenue Operations, G2 Verified Review
💰 The Replacement Math
One Oliv deployment with all eight specialized agents replaces what previously required:
Gong: $117k for 100 users (conversation intelligence)
Legacy Total: $377k+ annually Consolidated Agentic Platform: Fraction of legacy cost with superior automation Reduction: 80%+ when comparing like-for-like functionality
The architectural advantage isn't incremental improvement it's a category shift from tools requiring human operation to an AI workforce that autonomously executes revenue operations, delivering the productivity gains that justify aggressive consolidation.
Q9. Step-by-Step Framework to Consolidate Your Sales Stack in 2026 [toc=Consolidation Framework]
Successful consolidation requires structured execution across four quarters, balancing risk mitigation with aggressive cost reduction. This framework provides quarter-by-quarter milestones for organizations targeting 80% reduction in sales tech spending.
Q1 2026: Audit & Discovery Phase (Weeks 1-12)
Week 1-2: Complete Tool Inventory
Document every sales technology including shadow IT tools reps adopted independently
Record annual cost, user count, contract renewal dates, and cancellation windows
Identify stakeholders for each tool (sponsors, power users, administrators)
Week 3-5: Usage Analysis
Track login frequency over 30 days (daily/weekly/monthly/never users)
Calculate feature adoption rates (actively used features ÷ total available features × 100)
Survey end-users to identify which tools they'd miss if removed versus which are "compliance checkboxes"
"While Gong offers valuable insights into call data and sales interactions, our experience has been impacted by significant data access limitations... This lack of flexibility has required us to engage our development team at additional cost." - Neel P., Sales Operations Manager, G2 Verified Review
Week 6-8: Cost Mapping
Calculate true cost per active user including platform fees, integration costs, and admin burden
Document hidden expenses: implementation time (40-140 hours for tools like Gong), annual price increases (5-15%), seat reduction penalties
Create TCO comparison showing stacked costs (e.g., Gong + Clari + ZoomInfo = $500+ per user monthly)
"It was a big mistake on our part to commit to a two year term. Gong is a really powerful tool but it's probably the highest end option on the market... all have said the same thing they've been fine using a lower cost, simpler alternative." - Iris P., Head of Marketing & Sales Partnerships, G2 Verified Review
Contract Wind-Down Strategy:
Review existing contracts for cancellation clauses 90-180 days before renewal
Negotiate early termination for tools being replaced (leverage competitive quotes)
Request historical data exports in portable formats before cancellation notices
Q3 2026: Migration Execution (Weeks 27-39)
Phased Rollout Approach:
Pilot Phase (Weeks 27-30): Deploy with 10-15 users across different roles (BDR, AE, Manager)
Department Rollout (Weeks 31-35): Expand to full departments based on pilot success
Enterprise Deployment (Weeks 36-39): Complete migration with parallel systems for 2-week safety window
🔐 Data Migration Essentials
Data Migration Checklist:
Historical call recordings and transcripts (typically 12-24 months retention)
CRM field mappings and custom objects
Email templates, sequences, and cadences
Reporting dashboards and saved views
User permissions and role hierarchies
Training & Enablement:
Role-specific training sessions (30-45 minutes per persona)
Create quick-start guides and video tutorials
Designate department champions as first-line support
CRM data quality improvements (completeness, accuracy)
Support ticket volume and resolution times
90-Day Checkpoint:
Productivity gains measured (hours saved per rep/manager)
Pipeline velocity improvements (deal cycle time reductions)
First-quarter cost savings validated against projections
Year-End Assessment:
Annual cost reduction achieved (target: 60-80%)
ROI calculation (savings ÷ implementation cost)
Roadmap for additional optimization opportunities
"Clari has a very friendly user interface... but the analytics modules still needs some work... You have to click around through the different modules and extract the different pieces ultimately putting it in an excel for easier manipulation." - Natalie O., Sales Operations Manager, G2 Verified Review
How Oliv.ai Simplifies Consolidation: We provide complimentary migration project management, including historical Gong data imports at no additional cost, 5-minute instant deployment eliminating Q3 implementation overhead, and role-based onboarding that achieves >90% adoption within first 30 days compressing this 12-month framework into 8-12 weeks total.
Q10. Real Cost Comparison: Legacy Stack vs. Unified AI Platform (With Case Studies) [toc=Cost Comparison]
Understanding the true cost differential between stacked legacy tools and consolidated AI-native platforms requires line-item transparency across team sizes. These comparisons reveal where the 80% reduction math originates.
💰 50-Rep Team Cost Analysis
50-Rep Team: Legacy Stack vs. Unified AI Platform Annual Cost Comparison
100-Rep Team: Legacy Stack vs. Unified AI Platform Annual Cost Comparison
Cost Category
Legacy Stack (Annual)
Unified AI Platform (Annual)
Savings
Conversation Intelligence (Gong)
$140,000
Included
$140,000
Platform Fees (Gong)
$20,000
$0
$20,000
Forecasting (Clari)
$150,000
Included
$150,000
Data Enrichment (ZoomInfo + Apollo)
$75,000
Included
$75,000
Sales Engagement (Outreach)
$180,000
Included
$180,000
Mutual Action Plans (Recapped)
$24,000
Included
$24,000
RevOps Headcount (0.5 FTE for CRM cleanup)
$50,000
$0 (automated)
$50,000
Implementation
$35,000
$0
$35,000
Integration Middleware
$15,000
$0
$15,000
Total Annual Cost
$689,000
$75,000
$614,000 (89%)
"We are paying for double the amount of seats that we need. We only have 48 active users and are paying for 87... they signed us up for another year with the same amount of people. Multiple times they flat out refused [to renegotiate]." - Jessica W., IT Specialist, G2 Verified Review
💼 250-Rep Enterprise Cost Analysis
Legacy Stack Total: $1,875,000 annually
Gong Enterprise: $350,000 (includes $50k platform fee)
Managers spending 4+ hours weekly on manual forecast prep
Reps losing 2-3 hours daily to CRM updates
Three different platforms for essentially the same conversation data
"There's so much in Gong, that we don't really utilize but overall we are happy with the product... We could do more with the solution though." - Karel Bos, Head of Sales, TrustRadius Verified Review
The math demonstrates that 80% reduction isn't aspirational it's the documented outcome when consolidating from stacked legacy tools to purpose-built AI-native revenue orchestration platforms.
Q11. Common Consolidation Mistakes That Actually Increase Costs (Including Security & Compliance Failures) [toc=Consolidation Mistakes]
Even well-intentioned consolidation efforts can backfire when critical failure patterns aren't anticipated. These mistakes often result in higher total costs than maintaining the legacy stack.
❌ Mistake 1: Poor Migration Planning & Data Loss
The Problem: Organizations underestimate data portability challenges, discovering too late that legacy vendors make extraction deliberately difficult.
"If you're considering switching platforms and have six months or less on your contract, start engaging the Gong API documentation immediately to download all of your call data in a usable format... it requires downloading calls individually, which is impractical and inefficient for a large volume of data." - Neel P., Sales Operations Manager, G2 Verified Review
Cost Impact:
Emergency developer time to build custom extraction scripts: $15k-$40k
Lost historical data reduces new platform effectiveness by 30-40% in first 6 months
Duplicate licensing costs if migration extends beyond cancellation deadlines
Prevention Strategy:
Request data export 6+ months before contract end
Validate export format compatibility with new platform
Negotiate data migration services as part of new vendor contract
❌ Mistake 2: Eliminating Tools Too Quickly Without Replacement Validation
The Problem: Canceling legacy tools before confirming new platform handles all critical workflows creates gaps that force expensive emergency re-contracting or workarounds.
"The platform lacks task APIs, does not integrate with other vendors or parallel dialers, and isn't built to function as a proper sequencing tool... Our team is struggling with low adoption, and they won't even spend the time to support us during this transition." - Anonymous Reviewer, Gong Engage, G2 Review
💸 Cost Impact & Prevention
Cost Impact:
Emergency re-licensing of cancelled tools at list price: 20-40% premium
Shadow IT proliferation as teams adopt unsanctioned tools: $25k-$100k untracked spending
Revenue loss from workflow disruption during transition periods
Prevention Strategy:
Run parallel systems for 30-60 days minimum
Validate 100% feature parity for mission-critical workflows before cutover
Establish clear rollback criteria and keep legacy systems accessible
⚠️ Mistake 3: Underestimating Training Needs & Change Management
The Problem: Assuming "intuitive" platforms require minimal training leads to low adoption, forcing continued use of legacy tools and eliminating planned savings.
"It's too complicated, and not intuitive at all. Using it is very discomforting... understanding the pipeline management portion of it is almost impossible. Some people figure it out, but I think most just fumble through." - John S., Senior Account Executive, G2 Verified Review
Cost Impact:
Low adoption (<60%) eliminates 70-85% of projected ROI
Continued reliance on legacy tools despite paying for replacements (double-paying)
Extended implementations consuming 3-6 additional months of project resources
Prevention Strategy:
Budget 8-12 hours training time per user across first 90 days
Create role-specific certification programs with completion incentives using sales coaching software
Deploy department champions providing peer-to-peer support
The Problem: New platforms marketed as "fully integrated" often require significant custom development to match legacy tool workflow depth.
"Clari's integration capabilities are inadequate, particularly in pulling in call transcripts, which requires working with other tools." - Josiah R., Head of Sales Operations, G2 Verified Review
Cost Impact:
Custom integration development: $50k-$200k for complex CRM environments
Performance degradation from poorly architected integrations
Prevention Strategy:
Conduct technical due diligence with actual production data before signing
Require vendor to demonstrate integration with YOUR specific CRM configuration
Negotiate integration development costs into contract or select platforms with native deep integrations
🔒 Mistake 5: Compliance & Security Oversights During Consolidation
The Critical Failure: Data governance lapses during migration expose organizations to regulatory violations, especially when moving between platforms with different compliance certifications.
✅ Security Checklist for Consolidation
Security Checklist for Consolidation:
✅ Data Residency Verification
Confirm new platform stores data in compliant regions (EU for GDPR, specific states for CCPA)
Validate sub-processors meet same compliance standards as primary vendor
✅ SOC 2 Type II Certification
Verify active certification (not just "in progress")
Review specific trust service criteria (security, availability, confidentiality)
✅ Access Control Migration
Map role-based permissions from legacy to new system before cutover
Audit user access within 30 days of migration to remove orphaned permissions
✅ Data Retention Policy Alignment
Document what data is migrated vs. archived vs. deleted
Ensure retention periods comply with industry regulations (FINRA, HIPAA, etc.)
✅ Encryption Standards
Confirm encryption at-rest and in-transit meets organizational requirements
Validate API security for integrations (OAuth 2.0, token management)
Cost of Compliance Failures:
GDPR violations: €20M or 4% of global revenue (whichever is higher)
CCPA violations: $2,500-$7,500 per violation
SOC 2 audit failures: Loss of enterprise customer eligibility, emergency remediation $100k-$500k
Prevention Strategy:
Involve Legal/Compliance teams in vendor selection (Q2 evaluation phase)
Conduct security assessment comparing legacy vs. new platform certifications
Document data lineage during migration for audit trail purposes
The difference between successful consolidation (80% reduction) and failed consolidation (15% increase) hinges on anticipating these failure patterns and building safeguards into the implementation framework.
Q12. How to Measure ROI After Sales Tech Stack Consolidation [toc=Measuring ROI]
Demonstrating consolidation value requires comprehensive metrics across financial, operational, and revenue dimensions tracked at specific milestones. These frameworks provide CFO-ready ROI validation.
💰 Cost Savings Metrics (Hard Dollar Reduction)
Immediate Savings (Month 1):
Software license reduction (cancelled vs. active subscriptions)
Time to find account history across tools: 15 min → instant (unified view)
"I have to maintain my own separate spreadsheet to track deals because I can only capture what my leaders want to see about a deal... as a rep, I need to have fields like product interest, last activity notes, key contacts, deal challenges or blockers." - Verified User in Human Resources, G2 Verified Review
"Love the user-friendly features and the visibility it provides into our Sales forecast. We use Clari every week on our forecast call... because it presents the forecast in a clear, concise, and streamlined view." - Andrew P., Business Development Manager, G2 Verified Review
Measurement Tools:
CRM audit reports (field population percentages)
Data quality scorecards (accuracy, completeness, timeliness)
Forecast variance tracking (predicted vs. actual close rates)
Revenue Lift: $600,000 (10% win rate increase on $6M pipeline)
Total Value: $3,089,000
Implementation Cost: $75,000 (new platform + migration)
ROI: 4,019% first-year return
Payback Period: 0.9 months (less than 1 month)
⏰ Long-Term ROI Targets
Long-Term ROI Targets (3-5 Year Horizon):
Year 1: 3-5x ROI (implementation payback + first-year savings)
Year 2: 8-12x ROI (full productivity realization + compounding effects)
Year 3+: 15-20x ROI (sustained cost avoidance + continuous optimization)
"Clari has eliminated the need for sales QBRs for our groups... The reps always know where they stand now... it all depends how yours is configured, but ours has actually made forecast calls and access to the sales numbers soooo much easier." - ChimpDaddy2015, r/sales Reddit Thread
🎯 Milestone Tracking Calendar
30-Day Checkpoint:
User adoption: >80% active daily users
CRM completeness: +15-20 percentage points
Support ticket volume: <10 per 100 users
90-Day Checkpoint:
Productivity gains: 50% of projected savings realized
Data quality: 80% CRM completeness achieved
Cost savings: First full quarter validated
6-Month Checkpoint:
Pipeline velocity: 10-15% improvement
Win rates: 5-10% lift
Forecast accuracy: ±10-15% variance
12-Month Assessment:
Full annual savings: 60-80% reduction achieved
Productivity ROI: 3-5x first-year return
Revenue impact: 10-15% team quota attainment increase
The key to CFO approval and sustained executive sponsorship is tracking these metrics proactively and reporting progress monthly rather than waiting for annual reviews.
FAQ's
What does it mean to reduce sales tech stack costs by 80%, and is it realistic?
Reducing sales tech stack costs by 80% refers to eliminating redundant tools, consolidating overlapping functionality, and replacing legacy SaaS platforms with AI-native revenue orchestration systems that automate manual work rather than just providing dashboards. This isn't about cutting features—it's about architectural efficiency.
The 80% figure is realistic and documented. For example, a 100-user team running Gong ($140k), Clari ($150k), Outreach ($180k), ZoomInfo ($75k), and 0.5 FTE RevOps headcount ($50k) spends $689k annually. Consolidating to a unified AI-native platform at $75k annually represents 89% reduction. The math works because modern platforms eliminate platform fees ($20k), implementation overhead (8-24 weeks vs. instant), and the "human cost" of tool management.
We've seen this repeatedly: organizations paying for five note-takers capturing identical conversations, or maintaining separate tools for forecasting when their CRM already has native capabilities. The savings come from eliminating 300% redundancy, not sacrificing intelligence. Explore our pricing to see how modular agent-based costs compare to stacked legacy subscriptions.
How do I conduct a sales tech stack audit to identify cost reduction opportunities?
A systematic audit evaluates each tool against six criteria over 30 days: login frequency (daily/weekly/monthly/never), feature adoption rate (% of paid features actively used), cost-per-active-user, pipeline influence (measurable impact on win rates), integration health (error rates, sync breaks), and functional redundancy (overlapping capabilities across platforms).
Start by documenting every tool including shadow IT—reps often adopt unsanctioned solutions when official tools fail. Calculate the "feature adoption rate" formula: (Actively Used Features ÷ Total Available Features) × 100. Industry benchmarks show healthy adoption at 60-75%; anything below 40% is an elimination candidate. Tools like Gong often score <50% because teams pay for full coaching suites while using only basic recording.
The audit typically reveals 30-50% of paid seats fall into "monthly or never" usage categories, representing immediate savings. Map redundancies: if you're running Gong + Fireflies + Otter + Zoom native recordings, that's 300% redundancy for the same function. Book a demo to see how we automate this audit process and generate consolidation roadmaps with specific savings projections.
Which sales tools can I eliminate without losing productivity, by role?
Tool elimination depends on role-specific workflows. BDRs currently stack Apollo ($49-$99/user), ZoomInfo ($50k+ team minimum), LinkedIn Sales Nav ($79.99/user), and Salesloft ($100-$150/user)—totaling $200-$250+ monthly per BDR with massive functional overlap. These all perform variations of "find prospects and message them." A single AI-native research agent can replace this entire category.
AEs lose 2-3 hours daily to manual CRM updates ($15k+ annual productivity cost per rep), plus separate subscriptions for Gong ($1,360-$1,600/user annually), mutual action plan tools ($20-40/user monthly), and sequences. What AEs actually need is deal progression automation—agents that proactively identify at-risk opportunities and auto-update CRM fields, not dashboards requiring manual review.
Managers stack Gong for call review, Clari for forecasting ($150k+ team license), and Excel for "real forecasting" because Clari requires manual roll-ups. They spend Sunday nights building forecast slides for Monday morning meetings. Autonomous forecast agents inspect every deal line-by-line and deliver completed reports without manager input. We designed our platform around these role-specific needs—start a free trial to see which specific agents each role activates based on actual workflows.
What are the hidden costs of legacy sales tools like Gong and Clari?
Beyond published per-user pricing, legacy tools carry substantial hidden costs. Gong charges mandatory platform fees ($5k-$50k annually depending on team size)—essentially a "right to use the software" tax. Implementation consumes 8-24 weeks with 40-140 admin hours for manual Smart Tracker configuration because Gong's keyword-based technology requires defining every phrase variation. Bundling "Engage" and "Forecast" modules pushes total spend from $120-$160/user base rate to $250-$270/user monthly.
Renewal traps compound costs: contracts include 5-15% annual price increases and "seat reduction penalties" where decreasing user count triggers re-pricing at list rates, eliminating all negotiated discounts. Integration costs add $5k-$50k per integration for connecting to legacy CRM systems. Stacking Clari on top of Gong is a primary bloat driver—teams spend $250-$500 per rep before adding engagement tools or enrichment databases.
The "human cost" is often overlooked: 0.5-1.0 FTE RevOps headcount dedicated to CRM hygiene ($50k+ annual salary allocation), managers spending 4+ hours weekly on manual forecast prep, and the admin burden of maintaining tools that create more work than they eliminate. We architected our platform to eliminate these hidden costs entirely—zero platform fees, 5-minute instant setup, no forced bundles. See our pricing for transparent, all-inclusive cost structure.
How long does sales tech stack consolidation take, and what's the implementation timeline?
Traditional consolidation frameworks span four quarters: Q1 for audit and discovery (12 weeks documenting tools, usage patterns, and building business cases), Q2 for vendor evaluation and contract negotiation (13 weeks), Q3 for migration execution with phased rollout (13 weeks including pilot, department rollout, and enterprise deployment), and Q4 for measurement and optimization (13 weeks tracking adoption, productivity gains, and ROI validation).
However, this timeline assumes legacy platform implementations. Modern AI-native platforms compress Q3 dramatically—where Gong requires 8-24 weeks for Smart Tracker configuration and CRM field mapping, generative AI understands conversational intent contextually without manual training, enabling 5-minute instant deployment. The actual bottleneck becomes change management, not technical implementation.
With proper planning, we've helped organizations compress the 12-month framework to 8-12 weeks total by front-loading the audit (using automated redundancy mapping), conducting parallel vendor evaluation during audit phase, and leveraging instant deployment that eliminates traditional implementation overhead. Our complimentary migration project management includes historical data imports at no additional cost and role-based onboarding achieving >90% adoption within first 30 days. Book a consultation to develop your specific timeline based on team size and current stack complexity.
Why are AI-native platforms more cost-effective than stacking traditional SaaS tools like Gong + Clari?
The cost differential stems from fundamental architectural differences. Traditional SaaS platforms provide "human-in-the-loop" dashboards requiring manual action—Gong alerts say "this deal is at-risk," but a human must update CRM, build forecast slides, and craft follow-ups. You're paying for insights, then paying humans (or additional tools) to execute. Stacking Gong ($140k for 100 users) + Clari ($150k) + Outreach ($180k) + ZoomInfo ($75k) creates 300% functional redundancy while each requires separate integration, training, and admin overhead.
AI-native revenue orchestration platforms deploy autonomous agents that execute complete workflows end-to-end without human intervention. Our CRM Manager agent doesn't suggest field updates—it automatically updates Salesforce objects and custom fields after every interaction. The Forecaster agent doesn't flag at-risk deals for manager review—it autonomously inspects every deal line-by-line, applies MEDDPICC/BANT scoring, and delivers completed forecast reports. This isn't incremental improvement; it's replacing the human workforce with AI workforce.
Cost structure reflects this: legacy vendors charge per-user subscriptions ($120-$270/user monthly) plus platform fees ($5k-$50k annually) plus integration costs ($5k-$50k per integration) plus implementation (8-24 weeks consuming $15k-$35k). We charge modular agent-based pricing where BDRs activate only Researcher, AEs add Deal Driver and CRM Manager, Managers add Forecaster—you pay for agents actually deployed, not forced bundles where 70% of features go unused. Total platform cost runs 89% lower for equivalent (typically superior) functionality. Explore our pricing to configure exactly which agents your team needs.
How does migration from Gong or Clari to a unified platform actually work?
Migration follows a three-phase approach designed to minimize disruption. Phase 1 (Data Export & Validation, 2-4 weeks): Request historical data exports from existing vendors 6+ months before contract end—Gong provides API access for individual call downloads (labor-intensive but necessary), while Clari exports forecast data and pipeline snapshots. Validate data completeness: most organizations want 12-24 months of call recordings, transcripts, CRM field mappings, email sequences, and reporting dashboards preserved.
Phase 2 (Parallel Deployment, 2-4 weeks): Deploy the new platform alongside existing tools with a pilot group of 10-15 users across different roles (BDR, AE, Manager). This validates feature parity, integration health with your specific CRM configuration, and uncovers workflow gaps before full rollout. During this period, both systems run simultaneously—teams can reference historical Gong recordings while new conversations capture in the unified platform.
Phase 3 (Full Migration & Legacy Sunset, 2-4 weeks): Expand to department-wide rollout based on pilot success, complete enterprise deployment, maintain parallel systems for 2-week safety window, then cancel legacy subscriptions. Total timeline: 6-12 weeks from initiation to legacy tool cancellation.
We provide complimentary white-glove migration services including automated historical Gong data imports (our platform ingests existing recordings and transcripts at no additional cost), dedicated migration project manager, and role-based training achieving >90% adoption within 30 days. Unlike legacy vendors charging $15k-$35k for onboarding services, we include migration support as standard. Book a migration consultation to map your specific timeline and data preservation requirements.
Enjoyed the read? Join our founder for a quick 7-minute chat — no pitch, just a real conversation on how we’re rethinking RevOps with AI.
Revenue teams love Oliv
Here’s why:
All your deal data unified (from 30+ tools and tabs).
Insights are delivered to you directly, no digging.
AI agents automate tasks for you.
Thank you! Your submission has been received!
Oops! Something went wrong while submitting the form.
Meet Oliv’s AI Agents
Hi! I’m, Deal Driver
I track deals, flag risks, send weekly pipeline updates and give sales managers full visibility into deal progress
Hi! I’m, CRM Manager
I maintain CRM hygiene by updating core, custom and qualification fields, all without your team lifting a finger
Hi! I’m, Forecaster
I build accurate forecasts based on real deal movement and tell you which deals to pull in to hit your number
Hi! I’m, Coach
I believe performance fuels revenue. I spot skill gaps, score calls and build coaching plans to help every rep level up
Hi! I’m, Prospector
I dig into target accounts to surface the right contacts, tailor and time outreach so you always strike when it counts
Hi! I’m, Pipeline tracker
I call reps to get deal updates, and deliver a real-time, CRM-synced roll-up view of deal progress
Hi! I’m, Analyst
I answer complex pipeline questions, uncover deal patterns, and build reports that guide strategic decisions
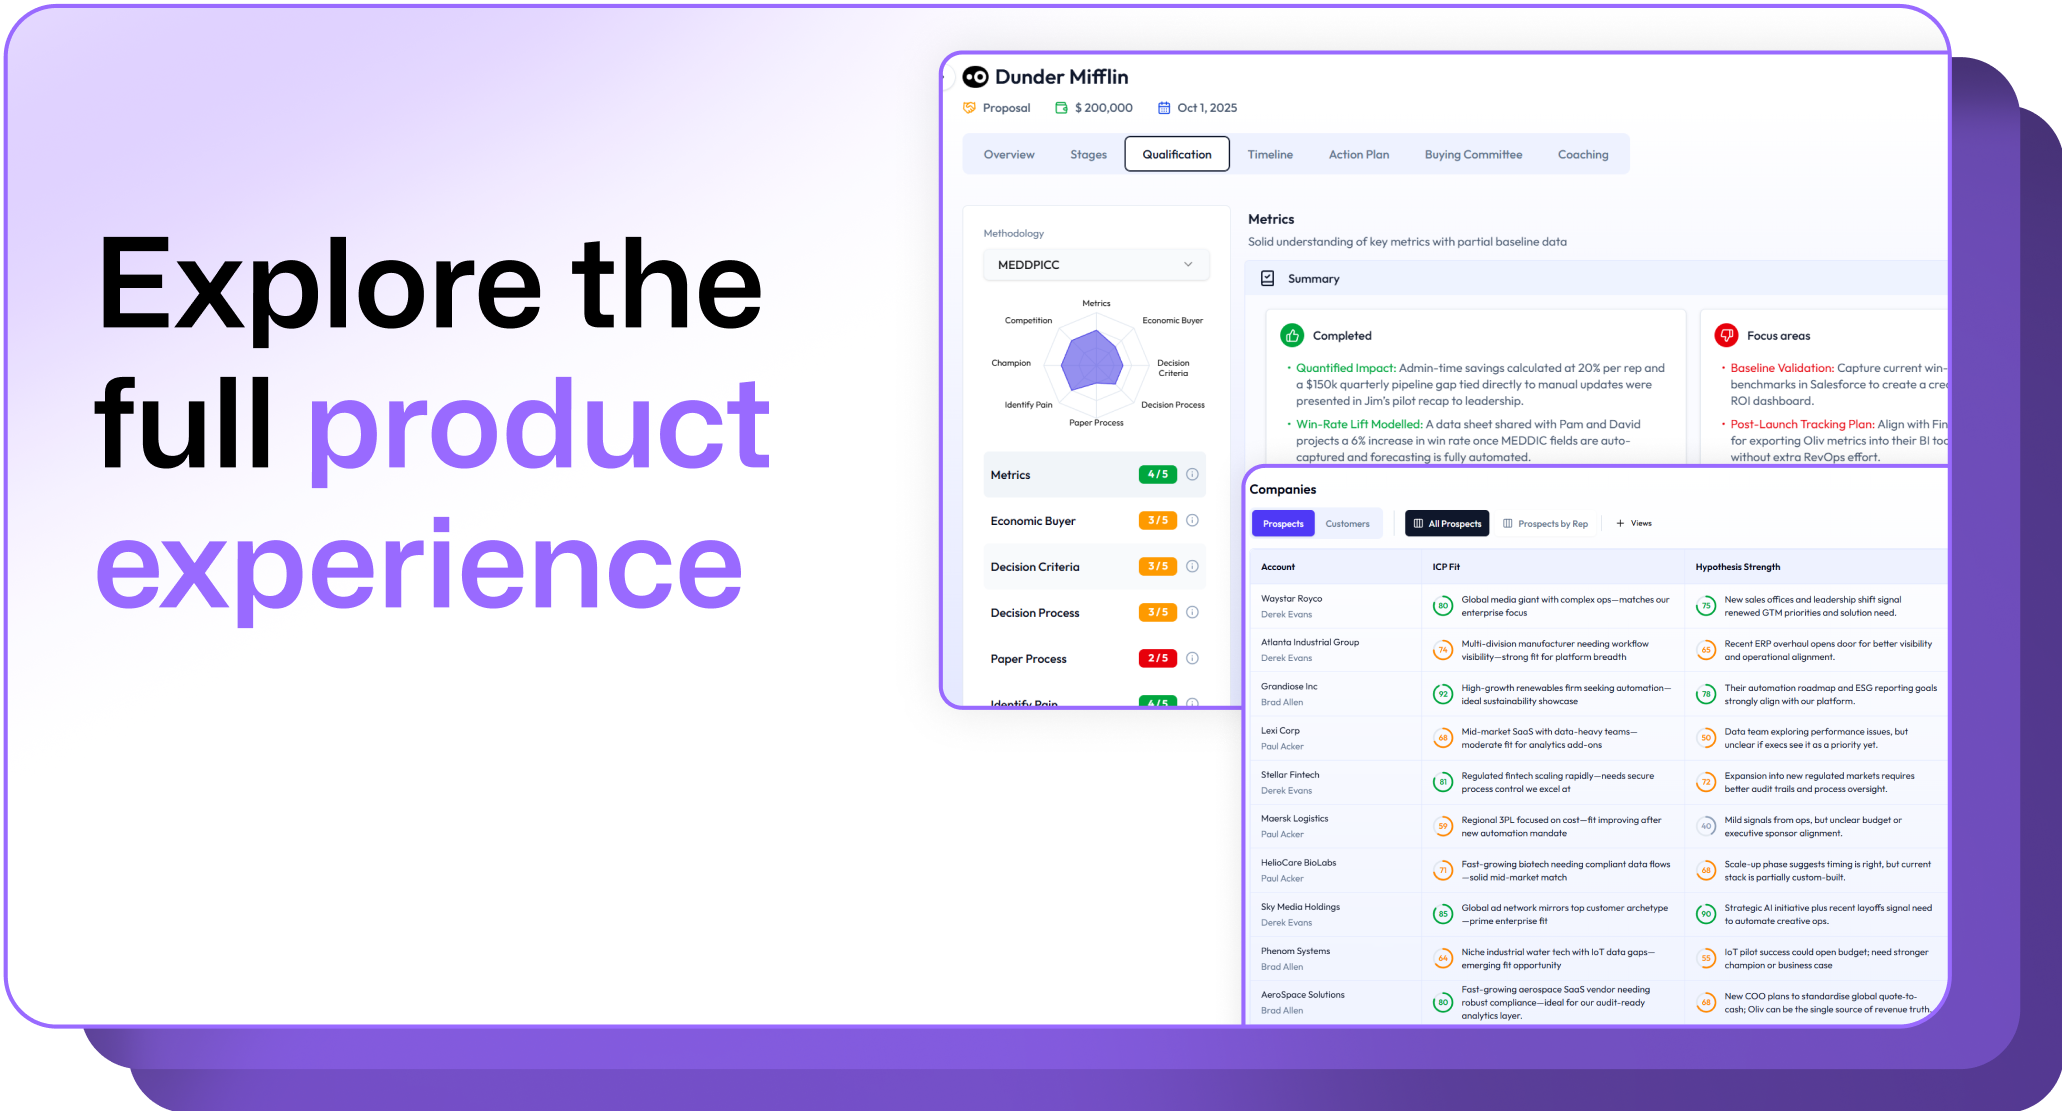
.avif)
.png)


.png)
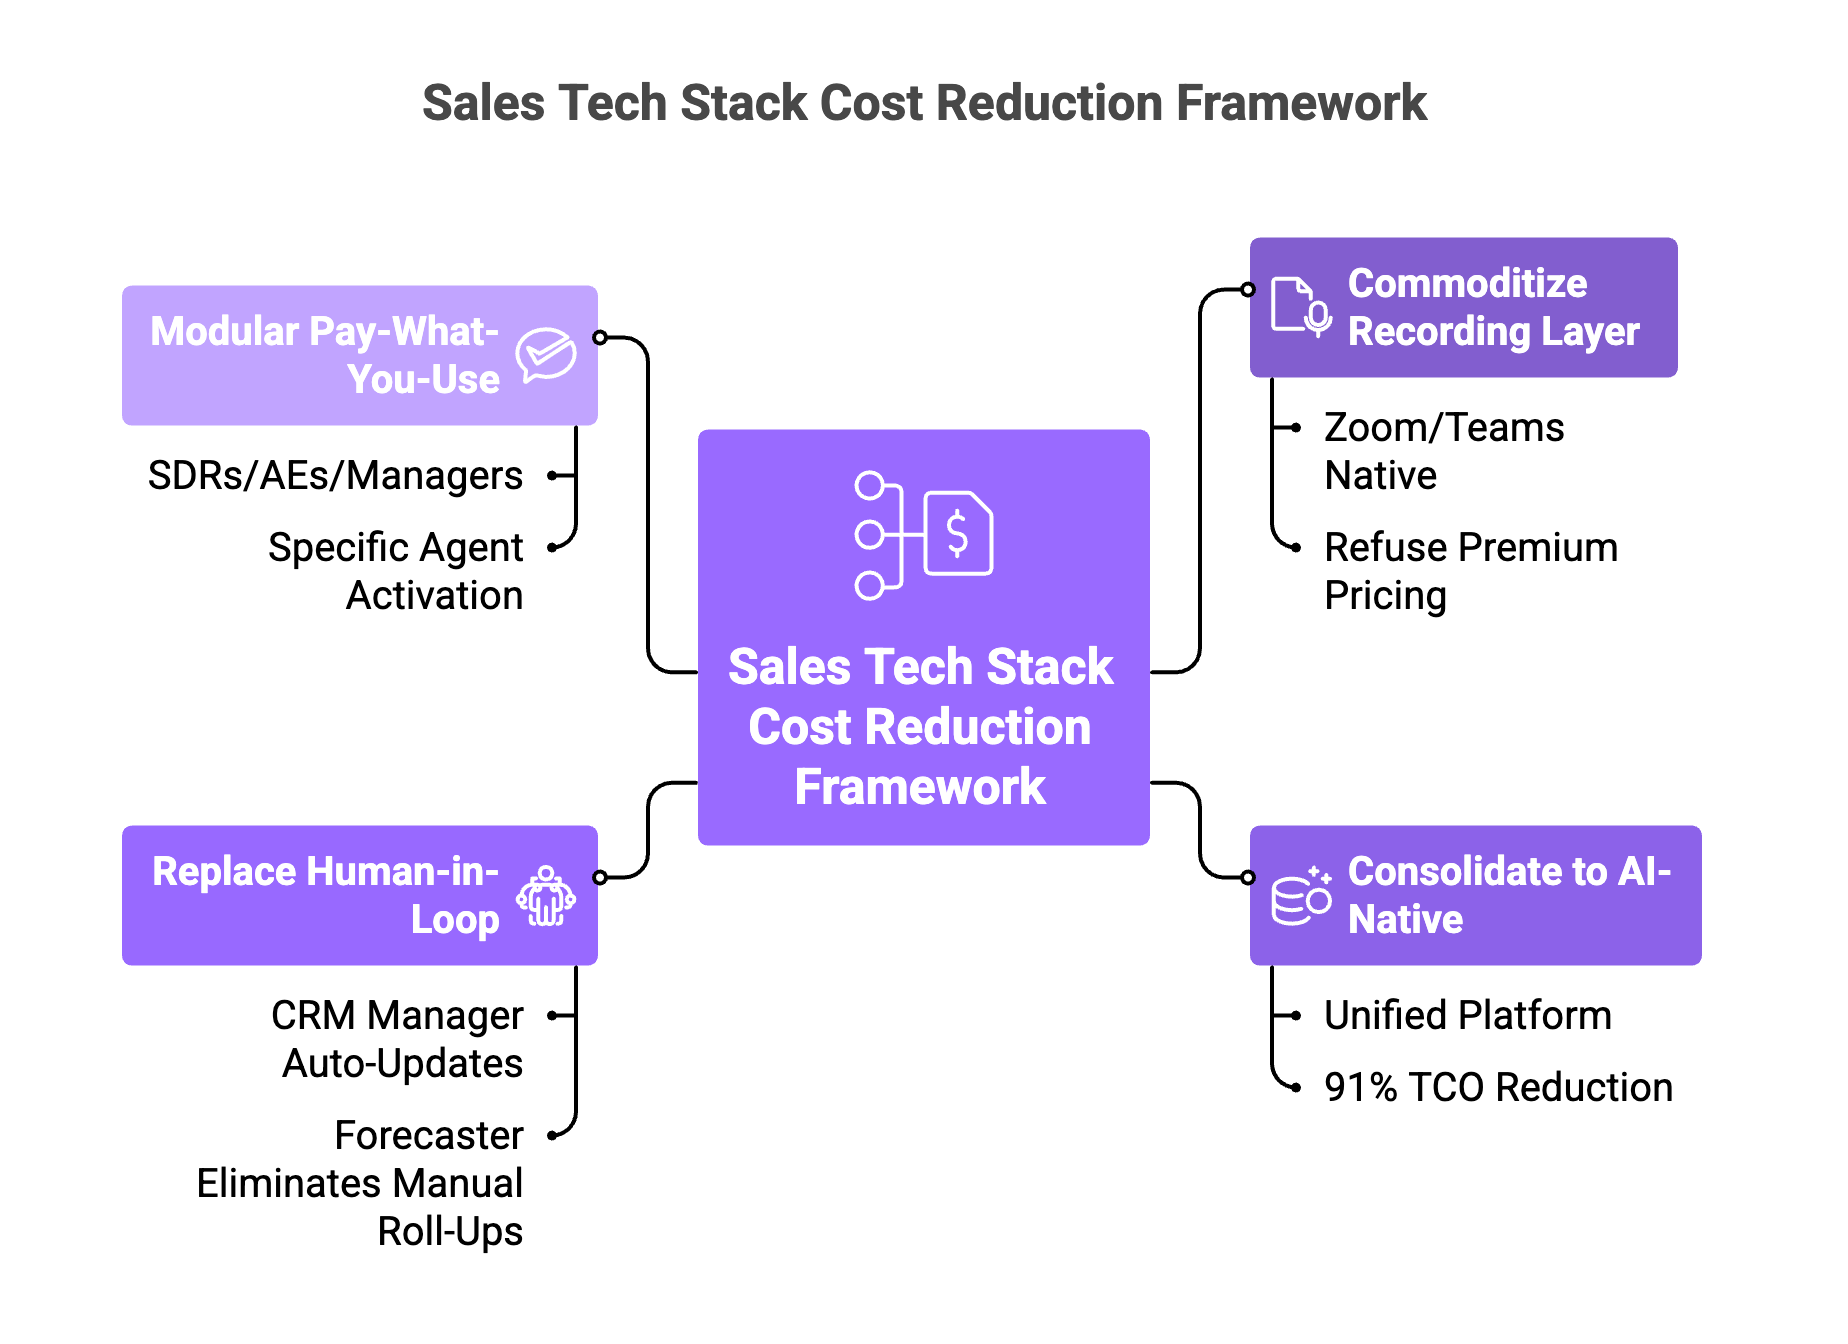
.png)
.png)
.png)