All your deal data unified (from 30+ tools and tabs).
Insights are delivered to you directly, no digging.
AI agents automate tasks for you.
Thank you! Your submission has been received!
Oops! Something went wrong while submitting the form.
Meet Oliv’s AI Agents
Hi! I’m, Deal Driver
I track deals, flag risks, send weekly pipeline updates and give sales managers full visibility into deal progress
Hi! I’m, CRM Manager
I maintain CRM hygiene by updating core, custom and qualification fields all without your team lifting a finger
Hi! I’m, Forecaster
I build accurate forecasts based on real deal movement and tell you which deals to pull in to hit your number
Hi! I’m, Coach
I believe performance fuels revenue. I spot skill gaps, score calls and build coaching plans to help every rep level up
Hi! I’m, Prospector
I dig into target accounts to surface the right contacts, tailor and time outreach so you always strike when it counts
Hi! I’m, Pipeline tracker
I call reps to get deal updates, and deliver a real-time, CRM-synced roll-up view of deal progress
Hi! I’m, Analyst
I answer complex pipeline questions, uncover deal patterns, and build reports that guide strategic decisions
TL;DR
B2B journey maps must include 6 lifecycle stages; treating Churn & Winback as a managed stage recovers 15 to 25% of lost accounts.
Buying committees of 6 to 10 stakeholders make single-persona journey maps dangerously incomplete for B2B.
82% of organizations create journey maps, but fewer than half use them effectively due to data gaps.
Legacy CS platforms like Gainsight require 3 to 6 months of implementation; AI-native tools deliver signals in days.
Stage-specific KPIs and a simple ROI formula turn journey mapping from "nice to have" into a board-level revenue driver.
Oliv.ai's 30+ autonomous agents automate data ingestion, churn detection, and CRM hygiene without dedicated CS-ops headcount.
Q1: What Is B2B Customer Journey Mapping and Why Does It Matter More in 2026? [toc=What Is Journey Mapping]
B2B customer journey mapping is the process of visualizing every interaction a business customer has with your company, from the first moment of awareness through renewal, expansion, and beyond. Unlike a simple sales funnel, a journey map captures touchpoints, emotional states, stakeholder motivations, and friction points across the entire customer lifecycle. In 2026, this matters more than ever: Forrester now frames journey management as moving "from maps to measurable impact," demanding that customer insight become accessible and accountable across the entire organization. A static PowerPoint slide no longer qualifies.
⚠️ The Legacy Approach Is Broken
Traditionally, B2B companies treated journey mapping as a one-time workshop exercise. A cross-functional team gathered in a conference room, sketched stages on a whiteboard, and exported the result into a slide deck that lived in a shared drive, untouched for months. Companies that do use journey data effectively see 1.7x higher customer retention rates, yet most maps never connect to real customer signals. The result? A beautiful artifact that reflects assumptions rather than reality, and a CS team still blindsided by churn.
🔄 The AI-Era Shift: From Static Maps to Living Intelligence
Modern journey mapping demands continuous signal ingestion, from recorded calls and email threads to support tickets, product usage, and Slack conversations. Gartner research shows 77% of B2B buyers describe their latest purchase as "very complex or difficult," involving multiple decision-makers and conflicting information. When the journey itself is this complex, the map must update itself. AI-powered platforms now extract sentiment shifts, competitor mentions, and churn risk indicators in real time, transforming the journey map from a retrospective diagram into a forward-looking intelligence layer.
See how B2B customer journey mapping evolved from static workshop slides to autonomous AI intelligence systems. Understand the three generations of journey mapping technology.
✅ How Oliv.ai Makes Journey Mapping a Living System
Oliv.ai approaches this differently from both legacy CS platforms (which require months of configuration) and meeting-level tools like Gong (which understand individual calls but miss the broader account narrative). Oliv's AI Data Platform stitches unstructured data from meetings, emails, Slack, Telegram, and the web into a continuous 360° account view, effectively making the journey map an always-on intelligence system rather than a static document.
The platform's specialized AI agents, including the Deal Driver Agent for real-time stage-transition alerts and the CRM Manager Agent for autonomous field updates, keep the journey map current without manual intervention. The difference is fundamental: instead of asking your team to maintain a journey map, Oliv builds and updates it for them.
"With Gong, I have trouble understanding breadth versus depth… Oliv is the first time I've ever been speechless. That's incredible." — Akil Sharperson, CS Lead at Triple Whale
Q2: What Are the 6 B2B Customer Lifecycle Stages (Including Churn & Winback)? [toc=6 Lifecycle Stages]
Most B2B lifecycle models stop at advocacy, as if every customer who signs a contract becomes a lifelong champion. In practice, churn is a predictable, manageable lifecycle stage, not a failure state. The framework below introduces six stages, including Churn & Winback, and maps each to its primary goal, key touchpoints, customer emotional state, owning teams, and critical KPIs.
📊 The 6-Stage B2B Customer Lifecycle Framework
The 6-Stage B2B Customer Lifecycle Framework
Stage
Primary Goal
Key Touchpoints
Customer Emotion
Owning Team(s)
Critical KPIs
1. Awareness
Build visibility and trust
Blog content, SEO, ABM campaigns, social, events
Curiosity mixed with skepticism
Marketing
Traffic, MQLs, brand recall
2. Consideration & Acquisition
Demonstrate value, close the deal
Case studies, demos, ROI calculators, proposals, procurement
Most competitors' guides treat churn as the end of the story. It isn't. Exit interviews reveal product gaps. Winback campaigns, when timed correctly (typically 60 to 90 days post-churn), recover 15 to 25% of lost accounts in mature B2B organizations. By treating Churn & Winback as a deliberate lifecycle stage with its own KPIs, owning teams, and playbooks, you turn losses into a feedback engine that strengthens every upstream stage.
Platforms like Oliv.ai support this model natively. The Health Monitor Agent identifies churn risk signals weeks before renewal, while Engagement Heatmaps surface accounts that have gone quiet, enabling intervention before Stage 6 becomes necessary.
Q3: How Does the B2B Customer Journey Differ from B2C? [toc=B2B vs B2C Differences]
The B2B customer journey operates under fundamentally different constraints than B2C. Understanding these differences is essential before building a journey map, because a framework designed for impulse-driven consumer purchases will fail in a world of 12-month sales cycles and 8-person buying committees.
📋 B2B vs. B2C Journey: Side-by-Side Comparison
B2B vs. B2C Journey: Side-by-Side Comparison
Dimension
B2B Journey
B2C Journey
Sales cycle length
Weeks to 12+ months
Minutes to days
Decision-makers
6 to 10 stakeholders per purchase (Gartner)
Usually 1 to 2 individuals
Purchase motivation
ROI, efficiency, strategic fit
Emotion, convenience, brand affinity
Touchpoint volume
20 to 50+ across channels
3 to 8 typically
Contract complexity
Multi-year, negotiated terms, SLAs
Standard pricing, easy cancellation
Post-sale importance
Critical, 70 to 80% of revenue from retention/expansion
Moderate, repeat purchases matter but at lower stakes
Personalization need
Account-level and role-specific
Individual consumer-level
Buying process structure
Non-linear "jobs to be done" (Gartner)
Largely linear funnel
Content requirements
Technical docs, ROI calculators, case studies, security reviews
Product pages, social proof, reviews
Relationship depth
High-touch, ongoing
Transactional, brand-driven
⏰ Why This Matters for Journey Mapping
Two dimensions deserve extra emphasis for journey map design:
Buying committees, not individual buyers. Gartner's research on 750 B2B buyers shows only 17% of the buying process is spent meeting with potential suppliers, and that time is split across multiple vendors. Your journey map must account for the CFO's risk concerns, the IT team's security review, and the end-user champion's adoption timeline, simultaneously. A single-persona map is dangerously incomplete.
Non-linear progression. B2B buyers work on multiple "jobs to be done" at the same time rather than progressing sequentially through stages. A buyer might loop back from consideration to awareness when a new stakeholder joins the decision. Your map needs to reflect these loops, not just a clean left-to-right funnel.
These structural differences are precisely why B2B journey mapping requires specialized approaches, and why tools built for B2C workflows consistently fall short when applied to multi-stakeholder, high-complexity B2B relationships.
Q4: What Are the Essential Components of a B2B Customer Journey Map? [toc=Essential Map Components]
A B2B customer journey map is only as useful as the components it includes. Most teams nail the basics, stages and touchpoints, but skip the elements that actually drive insight: emotional mapping, account-level stakeholder tracking, and real-time data source integration. Gartner's research confirms that B2B purchases typically involve 6 to 10 decision-makers, each with distinct priorities and emotional responses at every stage. A journey map that treats "the customer" as a single entity misses this entirely.
❌ Where Traditional Maps Fall Short
The seven essential components of a B2B journey map are:
(1) buyer personas, (2) touchpoints, (3) emotional states, (4) pain points, (5) goals/jobs-to-be-done, (6) account-level stakeholder mapping, and (7) data sources. Legacy maps typically capture only the first two. They define a generic "buyer" persona and list touchpoints by stage, but ignore the emotional dimension (frustration during onboarding, anxiety before renewal) and treat a 10-person buying committee as a monolith. The result is a map that describes what happens without explaining why, or for whom.
"Consider the costs and implementation time. Implementation took us a good 6 months, and now we cannot consider switching because of how entrenched we are with it, even though it is obscenely expensive." — Verified User in Computer Software, G2 Verified Review
🔄 AI-Era: From Manual Assembly to Automatic Detection
AI now transforms each of these components from a static checkbox into a living system. Emotional signals can be detected from conversation tone and word patterns across meetings. Stakeholders are identified automatically from meeting attendees, email cc lists, and CRM contact roles. Engagement levels per stakeholder are tracked continuously rather than guessed during quarterly reviews. This is the shift from documenting the journey to sensing it.
✅ How Oliv.ai Automates the Full Map Anatomy
Oliv.ai's architecture addresses all seven components natively. The Researcher Agent builds deep account dossiers that identify every stakeholder and their role within the buying committee. Contextual data stitching captures emotional signals (frustration, enthusiasm, risk indicators) directly from meeting transcripts, emails, and Slack threads. The 360° deal view maps each committee member's engagement across the full lifecycle independently, making account-level journey mapping automatic rather than manual.
"Setting up our ChurnZero instance has involved a significant amount of manual administration. The data transfer from our CRM to Salesforce is not straightforward, which has forced us to create numerous workarounds." — Brandon O., Client Education Manager, G2 Verified Review
Where legacy platforms require months of configuration to map a single journey dimension, Oliv's agent-first approach assembles the complete picture (personas, touchpoints, emotions, stakeholder engagement, and data sources) from day one.
Q5: How Do You Build a B2B Customer Journey Map Step by Step? [toc=Step-by-Step Build Guide]
Building a B2B customer journey map is a cross-functional process, not a one-department project. It requires alignment between sales, marketing, customer success, and product teams to create something that reflects the actual customer experience rather than internal assumptions. Here's a practical 7-step framework:
Follow this 7-step flowchart to build a B2B customer journey map from scratch. Learn where most teams fail and how AI automates each stage of the process.
Define objectives: tie the map to a measurable outcome (reduce churn, improve onboarding TTFV, increase NRR)
Build buyer personas: include all buying committee roles, not just the champion
Map touchpoints per lifecycle stage: from first ad impression through renewal
Layer in emotional states: frustration, confidence, anxiety at each transition
Identify gaps and moments of truth: where do customers stall, disengage, or escalate?
Establish a continuous review cadence: quarterly at minimum; real-time if your tools allow it
❌ Where Traditional Execution Breaks Down
In practice, most teams execute this process using manual surveys, scattered CRM notes, and gut-feel from a handful of reps. A Gartner survey found that while 82% of organizations have created journey maps, only 47% are effectively using them. The reason is a data coverage problem: touchpoints from unrecorded phone calls, Slack threads, and email chains remain invisible. The resulting map reflects perhaps 30% of the real customer experience, a hypothesis dressed up as strategy.
🔄 The AI-Era Approach: Automate Data Ingestion
The best teams in 2026 automate data ingestion across every channel. AI continuously extracts signals, competitor mentions, churn risk language, expansion cues, sentiment shifts, without waiting for someone to log a note. When 77% of B2B buyers call their latest purchase "very complex," the volume of interactions per account is simply too high for manual mapping to capture accurately.
✅ How Oliv.ai Turns Steps into a Living System
Oliv.ai's AI Data Platform auto-captures data from meetings, emails, Slack, Telegram, and the web, eliminating the manual data audit entirely. The CRM Manager Agent keeps fields current without rep intervention. The Deal Driver Agent flags journey-stage transitions in real time. The Researcher Agent builds account dossiers automatically. The result: a journey map that updates itself as a live intelligence dashboard.
⏰ Oliv's baseline configuration takes 5 minutes, with core value realized in 1 to 2 days, compared to the 3 to 6 month implementation cycles common with legacy CS platforms.
"The implementation/integration is a nightmare. You really need to have dedicated resources to managing and ongoing administration on this tool." — Verified User in IT Services, G2 Verified Review
Q6: What Are the Most Common B2B Journey Mapping Mistakes (and How Do They Cause Churn)? [toc=Common Mapping Mistakes]
Despite widespread adoption, most B2B journey maps fail to reduce churn, because the mapping process itself contains structural errors that guarantee blind spots. Gartner found that 82% of organizations have created customer journey maps, yet fewer than half use them effectively. The gap between mapping and impact is where churn hides.
⚠️ 6 Mistakes That Directly Cause Churn
6 Mistakes That Directly Cause Churn
#
Mistake
Churn Consequence
1
Map-once-and-forget
Journey drifts from reality → interventions miss the mark → customers feel unseen
2
Ignoring post-sale stages
80% of B2B revenue comes from retention/expansion, yet most maps end at purchase
Marketing owns pre-sale, CS owns post-sale, nobody owns the full journey
5
No emotional layer
Frustration during onboarding or anxiety before renewal goes unmapped → disengagement
6
Treating all accounts identically
Enterprise and SMB accounts have different journeys, one map cannot serve both
❌ The Root Cause Is a Data Problem
These aren't strategy failures, they're data failures. When 75% of companies approach journey mapping from an internal perspective rather than actual customer experience data, the map becomes self-referential. The fix isn't another workshop. It's continuous, multi-channel signal ingestion that keeps the map honest. Predictive churn scoring and conversational intelligence close this gap by analyzing patterns humans simply can't track at scale.
✅ How Oliv.ai Prevents These Mistakes by Design
Oliv's contextual data stitching eliminates siloed views by unifying calls, emails, Slack, and support data into a single 360° account narrative. The Health Monitor and Retention Forecaster Agents scan accounts weekly for usage and support anomalies, catching the signals that anecdotal rep data misses. The Voice Agent captures off-the-record data from unrecorded interactions, closing the single biggest data gap in most journey maps.
"We are also having a hard time with our CSMs adopting and trusting Gainsight." — Verified User in Computer Software, G2 Verified Review
"Gong blew up my Slack all day, but I still had to click through ten screens just to find something useful. With Oliv, I finally get what I need… dropped right in my inbox." — Mia Patterson, Sales Manager at Mid Market Firm
Q7: How Does Customer Journey Mapping Actually Reduce Churn? [toc=Churn Reduction Mechanism]
Journey mapping reduces churn through a simple but powerful mechanism: it makes risk visible before it's too late. When you can see exactly where customers disengage, during onboarding, after a failed QBR, or in the quiet months before renewal, you can intervene proactively rather than reactively. The three mechanisms that drive this are:
Early signal detection: identifying behavioral and sentiment shifts weeks before cancellation
Proactive intervention: triggering the right action at the right journey stage
Closed-loop feedback: feeding outcomes back into the map to improve future interventions
Understand the 3 mechanisms that make B2B journey mapping reduce churn: signal detection, proactive intervention, and closed-loop feedback. See the cycle in action.
❌ Traditional Churn Prevention: Too Little, Too Late
Most B2B teams detect churn reactively, a customer stops logging in, a renewal conversation goes cold, or a QBR reveals frustration that's been brewing for months. Legacy CS platforms like Gainsight and ChurnZerocan surface risk signals, but they require significant configuration, dedicated CS-ops resources, and months of implementation to become functional.
"Setting up our ChurnZero instance has involved a significant amount of manual administration… the tool hasn't delivered the time savings we were hoping for." — Brandon O., Client Education Manager, G2 Verified Review
🔄 AI Flips Churn Prevention from Reactive to Predictive
AI-powered journey intelligence changes the equation entirely. Predictive churn scoring now analyzes engagement patterns, sentiment shifts in conversations, support ticket velocity, and usage anomalies, continuously. Conversational intelligence detects risk language in meetings (budget concerns, competitor mentions, stakeholder changes) before it becomes a formal support ticket. Automated playbooks then trigger the right intervention at the right stage without manual monitoring.
✅ Oliv.ai's Churn-Reduction Architecture
Oliv approaches churn prevention as an always-on intelligence layer rather than a dashboard you check weekly:
Health Monitor Agent: scans accounts weekly for usage/support anomalies, alerts CSMs before risk peaks
Expansion Signal Detection: spots cross-sell opportunities during MBRs
Engagement Heatmaps: surface which accounts in a 100-account book haven't had meaningful contact recently
MAP Manager Agent: tracks onboarding milestones to ensure customers hit time-to-value fast
⏰ Oliv delivers actionable churn signals within 1 to 2 days of setup, not 3 to 6 months. For lean CS teams that want intelligence without complexity, that speed-to-insight difference is the difference between catching churn and reading about it in a quarterly report.
Q8: What Tools and Frameworks Power B2B Customer Journey Mapping in 2026? [toc=Tools and Frameworks]
The B2B customer journey mapping landscape in 2026 spans five categories, each serving a different layer of the lifecycle. Choosing the right combination depends on team size, technical maturity, and whether you need workflow management or intelligence.
📋 Tool Landscape Overview
B2B Customer Journey Mapping Tool Landscape in 2026
Popular frameworks include AARRR (pirate metrics for acquisition-through-revenue), Bow-Tie (symmetrical pre- and post-sale design), and Lifecycle Grid (stage x segment mapping).
⚠️ Where Incumbents Shine and Over-Engineer
✅ Gainsight and Totango are powerful for large, CS-ops-heavy organizations that need deep workflow orchestration and scaled playbook automation. ❌ However, they're configuration-first, expensive, and slow to implement. ✅ Gong delivers brilliant meeting-level conversational intelligence. ❌ But it misses the broader deal narrative, emails, Slack threads, and multi-channel context. ✅ ChurnZero is straightforward for SMB CS teams. ❌ But users consistently note limited reporting and functionality constraints at scale.
"There is an excessive focus on AI at the expense of addressing basic features, parity issues, and stability problems… The admin community has been requesting these basic improvements for years."| — Verified User in Computer Software, Enterprise, G2 Verified Review
"On the customer tracking side it was awesome. Very robust. But the cost was extreme for what you got." — Nate H., Customer Success Rep, G2 Verified Review
✅ Oliv.ai: Signals, Not Software
Oliv.ai is built for modern, leaner CS and revenue teams that want intelligence without months of configuration. With 30+ specialized AI agents covering the full journey (Researcher → CRM Manager → Deal Driver → MAP Manager → Health Monitor → QBR Builder), the platform consolidates what traditionally required 3 to 5 separate tools. Setup takes minutes. Modular pricing means teams pay only for the agents they use. A full open data export policy ensures zero vendor lock-in.
"Oliv fixes the data as it happens and drops a forecast I can actually bank on." — Darius Kim, Head of RevOps at Driftloop
Q9: How Should Different Teams Use the Journey Map? (Roles, Template & Example) [toc=Team Roles and Template]
A journey map is only valuable when every team knows exactly what to do with it. Too often, a beautifully designed map sits in a shared folder because nobody assigned ownership per stage. The reality of B2B customer lifecycle management is that multiple teams, Marketing, Sales, CS, RevOps, and Product, must co-own the map with clear, non-overlapping responsibilities.
📋 Part A: Role x Stage Responsibility Matrix
Role x Stage Responsibility Matrix
Lifecycle Stage
Marketing
Sales
Customer Success
RevOps
Product
Awareness
⭐ Primary: content, ABM, SEO
Support: social selling
-
Data: attribution tracking
-
Consideration
Nurture: case studies, webinars
⭐ Primary: demos, proposals
-
Pipeline: stage accuracy
Feature: competitive intel
Onboarding
-
Handoff: context transfer
⭐ Primary: kickoff, training
Systems: CRM-to-CS sync
⭐ Co-own: implementation support
Growth & Expansion
Adoption: feature campaigns
Upsell/cross-sell
⭐ Primary: QBRs, health reviews
Analytics: NRR tracking
Roadmap: feature adoption
Renewal & Advocacy
Advocacy: referral programs
Renewal negotiation
⭐ Primary: renewal management
Forecasting: renewal pipeline
-
Churn & Winback
Winback: re-engagement campaigns
-
⭐ Primary: exit interviews
Analysis: churn pattern reporting
Feedback: product gap fixes
📊 Part B: Complete B2B Journey Map Template
Complete B2B Journey Map Template
Stage
Key Touchpoints
Customer Emotion
Pain Points
KPIs
Owning Team
Recommended Action
AI Automation Opportunity
Awareness
Blog, SEO, events, ABM ads
Curiosity + skepticism
Information overload
MQLs, traffic, brand recall
Marketing
Deliver targeted, persona-specific content
Researcher Agent: account dossiers for targeted outreach
"I need more data on onboarding journeys and customer health. It helps to know if users are active in their site but it's hard to see which user did what." — Chauntee C., Implementation Specialist, G2 Verified Review
Oliv.ai simplifies role-based journey execution by delivering stage-specific intelligence directly to each team where they already work, Slack, email, or CRM, without requiring anyone to log into a separate dashboard.
Q10: How Do You Measure Journey Success and Prove the ROI of Customer Journey Mapping? [toc=Measurement and ROI]
Journey mapping without measurement is decoration. Every lifecycle stage from Awareness to Churn & Winback needs its own success metrics, and those metrics need to connect to a clear ROI framework that justifies ongoing investment in CJM tools and processes.
Exit interview completion rate, product gap closure rate
💰 Simple ROI Formula: ROI = (Revenue Retained via CJM - Investment in CJM Tools & Process) / Investment x 100
❌ The Traditional Measurement Gap
In practice, metrics live in disconnected dashboards, NPS in one tool, usage data in another, revenue in the CRM. Correlating a journey-stage intervention (say, a proactive QBR at month 9) to a retention outcome (renewal at month 12) requires manual analysis that rarely happens. Most teams never calculate the ROI of their journey mapping investment. The result: CJM gets perceived as a "nice to have" rather than a revenue driver, and budgets get cut when they should be growing.
"Even basic features, like easily viewing my portfolio, are lacking, so I end up using spreadsheets instead of Gainsight for this purpose." — Alberto S., Enterprise, G2 Verified Review
🔄 AI Makes Measurement Automatic
Modern AI platforms auto-correlate journey-stage actions to downstream retention outcomes. Instead of manually querying which onboarding interventions predict 12-month renewal, AI surfaces these patterns continuously, turning measurement from a quarterly exercise into an always-on feedback loop.
✅ How Oliv.ai Makes ROI Visible Without Extra Work
Oliv's Forecaster Agent delivers weekly unbiased deal and account health roll-ups, with risk commentary and one-click presentation-ready decks for board calls. The Analyst Agent lets any team member ask plain-English questions like "Which onboarding milestones correlate with 12-month retention?" without writing SQL. The Coach Agent connects journey quality to individual rep behavior, closing the loop between process and performance.
Measurement becomes a byproduct of the system, not additional workload. When every intervention, touchpoint, and outcome is automatically tracked and correlated, proving ROI stops being a quarterly project and becomes a default state.
Q11: Frequently Asked Questions About B2B Customer Journey Mapping [toc=FAQs]
How long does it take to create a B2B customer journey map? A basic journey map can be drafted in 1 to 2 workshops (2 to 4 weeks total) if your team has existing customer data. A comprehensive map with emotional layers, account-level stakeholder mapping, and stage-specific KPIs typically takes 6 to 8 weeks using traditional methods. AI-native platforms like Oliv.ai reduce this to days by auto-ingesting data from calls, emails, and CRM records from the moment of integration.
🔄 How Often Should You Update Your Map?
How often should you update your journey map? At minimum, quarterly. In practice, the best-performing teams treat the journey map as a living document that updates continuously based on new customer signals. Static maps become outdated within weeks as buying behaviors, stakeholder roles, and market conditions shift.
Who should own the B2B customer journey map? No single team should own it exclusively. RevOps is typically best positioned to steward the map cross-functionally, while Marketing, Sales, CS, and Product each own their respective stages (see Q9 matrix above). The worst outcome is siloed ownership where marketing owns pre-sale and CS owns post-sale with no one bridging the handoff.
⭐ Journey Map vs. Sales Funnel
What's the difference between a customer journey map and a sales funnel? A sales funnel is internally focused, it tracks how your company moves leads through pipeline stages. A journey map is externally focused, it captures the customer's experience, emotions, and decisions across every touchpoint. Journey maps are broader (covering post-sale), deeper (including emotions and pain points), and more actionable for cross-functional teams.
Can small B2B teams benefit from journey mapping, or is it only for enterprise? Journey mapping delivers outsized value for smaller teams precisely because they can't afford to lose customers. A startup with 50 accounts losing one customer feels the impact far more than an enterprise with 5,000. Lean teams benefit most from AI-powered tools that surface journey intelligence without requiring dedicated CS-ops headcount.
"Customer Experience and Journey tracking. We didn't have a good way to track this, and using our CRM for it was not worth it." — Nate H., Customer Success Rep, G2 Verified Review
Q12: Start Mapping or Start Losing Customers You Could Have Saved [toc=Start Mapping Now]
The B2B customer journey in 2026 is too complex, too multi-threaded, and too high-stakes for static maps and manual monitoring. Companies that treat journey mapping as a living, AI-powered intelligence layer, not a one-time workshop exercise, will retain more customers, expand more accounts, and build the kind of predictable revenue that boards actually trust.
✅ The Essential Elements Are Clear
✅ 6 lifecycle stages including Churn & Winback as a managed, proactive stage
✅ Account-level mapping that reflects buying committees, not single contacts
✅ Emotional layers that capture the why behind customer behavior
✅ Stage-specific KPIs tied to a measurable ROI framework
✅ Continuous signal ingestion, not quarterly updates
"Gainsight has become the heart of our insight generation… while in theory, nothing seems impossible, the practical application often tells a different story." — Verified User in Computer Software, Enterprise, G2 Verified Review
⏰ Intelligence Without Complexity
If your team wants journey intelligence without 6-month implementations, mandatory platform fees, or dedicated CS-ops headcount, Oliv.ai's agent-first approach delivers signals, not software. With 30+ specialized AI agents, 5-minute setup, and modular pricing, we help lean revenue teams see what matters and act on it before churn becomes a quarterly surprise.
[Book a Demo →] See how Oliv.ai turns your customer journey into a living intelligence system.
FAQ's
What is B2B customer journey mapping?
B2B customer journey mapping is the systematic visualization and optimization of every touchpoint a business buyer encounters—from initial awareness through purchase, onboarding, and renewal. Unlike B2C journeys that involve individual decisions, B2B mapping must account for 6-10 stakeholder buying committees, sales cycles spanning 3-12 months, and complex handoffs between sales and customer success teams.
In 2026, effective journey mapping has evolved beyond static PowerPoint documentation. We focus on creating living, data-driven maps that stitch together signals from meetings, emails, Slack, and support tickets into a unified 360-degree view. This allows teams to identify churn risks and expansion opportunities in real-time rather than discovering problems at renewal. Read more about our features to see how agentic automation transforms journey visibility.
What are the 5 B2B customer lifecycle stages?
The modern B2B customer lifecycle comprises five distinct stages, each requiring specific touchpoints, KPIs, and agentic support:
Prospecting & Discovery — The research phase where buyers identify problems and evaluate solutions
Sales Execution & Qualification — Active selling with demos, evaluations, and buying committee navigation
The Handoff — Critical context transfer from sales to customer success
Onboarding & Adoption — Implementation, training, and first value realization
Renewal & Expansion — Retention focus and identification of growth opportunities
Each stage has unique churn indicators. For example, during handoff, missing "why now" context or undocumented executive objections create downstream retention risks. We've built specialized agents for each stage—from our Researcher Agent for discovery to our Health Monitor for renewal—ensuring no context is lost during transitions. Book a quick demo to see stage-specific automation in action.
How does customer journey mapping reduce B2B churn?
Journey mapping reduces churn by shifting from reactive documentation to proactive intervention. Traditional health scores based on login data flag problems only after customers have mentally churned—often 60+ days before renewal when it's too late to save the account.
Effective churn reduction requires four pillars: (1) proactive daily alerts over static dashboards, (2) automated CRM hygiene ensuring context-complete handoffs, (3) strategic analysis answering "why are we losing deals to Competitor X?", and (4) personalized coaching closing rep skill gaps.
Our Health Monitor and Retention Forecaster scan usage patterns, support tickets, and Slack shared channels to surface risk signals 90+ days before renewal. This proactive approach yields 3x higher save rates compared to 30-day reactive outreach. Teams using unified AI platforms consistently see 25% higher forecast accuracy and 35% higher win rates. Explore our live product sandbox to experience proactive churn detection.
What are the most common B2B customer journey mapping mistakes?
Organizations consistently make ten critical mistakes that undermine journey mapping initiatives:
Data & Process Failures:
The CRM Hygiene Trap — assuming CRM is "source of truth" when rep neglect makes data meaningless
Rep-Driven Reviews — managers see only what reps choose to show, hiding stalled deals
"Five Note-Takers, Zero Execution" — recording meetings without completing tasks
Siloed Touchpoint Data — customer interactions scattered across 8+ disconnected tools
Missing handoff context, ignored digital signals, tool sprawl costing $500+/user/month, assumption-based personas, and no stage-specific KPIs
We address each anti-pattern systematically. Our CRM Manager auto-populates 100+ fields across MEDDPICC, BANT, and SPICED methodologies, while our Deal Driver surfaces stalled deals daily without rep input. See our pricing plans to understand how modular agents eliminate tool sprawl costs.
What is a B2B journey mapping maturity model?
A journey mapping maturity model assesses organizational capability across four progressive levels:
Level 1 (Reactive): No formal journey map; tribal knowledge drives handoffs; churn discovered at renewal; CRM data unreliable. Teams spend Thursday-Friday manually reviewing deals to prepare Monday forecasts.
Level 2 (Documented): Static maps exist but updated annually; CRM sync semi-automated (notes only); churn flagged 30-60 days before renewal.
Level 3 (Integrated): Maps informed by quarterly customer research; CRM fields auto-populated; cross-functional visibility established; churn predicted 60-90 days out.
Level 4 (Predictive/Agentic): AI agents execute interventions autonomously; signals stitched across all channels in real-time; churn predicted 90+ days before renewal; CRM fully autonomous.
Most organizations operate at Level 1-2 while market leaders achieve Level 4. We've architected our platform to accelerate this progression—combining a data platform layer (stitching), intelligence layer (signal detection), and agent layer (autonomous execution) to move teams from Reactive to Predictive in weeks. Start a free trial to assess your current maturity level.
What KPIs should I track for each customer journey stage?
Stage-specific metrics detect problems before they compound. Here are the critical KPIs by stage:
Renewal: Net Revenue Retention (>110%), health score accuracy (>75%), expansion rate (>25%), churn prediction lead time (>90 days)
Rather than manually calculating these across siloed systems, our Analyst Agent enables RevOps leaders to query any KPI in plain English—receiving instant visual dashboards without SQL knowledge. Book a quick demo to see natural language analytics in action.
How long does it take to implement Oliv AI for journey mapping?
Implementation timelines represent a fundamental architectural difference between legacy SaaS and AI-native platforms. Traditional tools like Gong require 8-24 weeks for full deployment, including extensive training and adoption cycles.
Our implementation follows a compressed timeline:
Baseline Configuration: 5 minutes — connect CRM and calendar
Core Deployment: 1-2 days — value realization begins
Full Customization: 2-4 weeks — complex model building and workflow integration
This rapid time-to-value stems from our agent-first architecture. Rather than requiring teams to learn new interfaces and workflows, our agents deliver insights directly where teams already work—Slack, Email, and within the CRM itself. We also provide free data migration services to import historical recordings and metadata from legacy platforms.
Technical requirements are minimal: administrative access to your CRM (Salesforce, HubSpot, Dynamics, Pipedrive, or Zoho) and calendar/email provider. Security certifications (SOC 2 Type II, GDPR, CCPA) are included out of the box. Book a quick demo to discuss your specific implementation timeline.
Enjoyed the read? Join our founder for a quick 7-minute chat — no pitch, just a real conversation on how we’re rethinking RevOps with AI.
Revenue teams love Oliv
Here’s why:
All your deal data unified (from 30+ tools and tabs).
Insights are delivered to you directly, no digging.
AI agents automate tasks for you.
Thank you! Your submission has been received!
Oops! Something went wrong while submitting the form.
Meet Oliv’s AI Agents
Hi! I’m, Deal Driver
I track deals, flag risks, send weekly pipeline updates and give sales managers full visibility into deal progress
Hi! I’m, CRM Manager
I maintain CRM hygiene by updating core, custom and qualification fields, all without your team lifting a finger
Hi! I’m, Forecaster
I build accurate forecasts based on real deal movement and tell you which deals to pull in to hit your number
Hi! I’m, Coach
I believe performance fuels revenue. I spot skill gaps, score calls and build coaching plans to help every rep level up
Hi! I’m, Prospector
I dig into target accounts to surface the right contacts, tailor and time outreach so you always strike when it counts
Hi! I’m, Pipeline tracker
I call reps to get deal updates, and deliver a real-time, CRM-synced roll-up view of deal progress
Hi! I’m, Analyst
I answer complex pipeline questions, uncover deal patterns, and build reports that guide strategic decisions
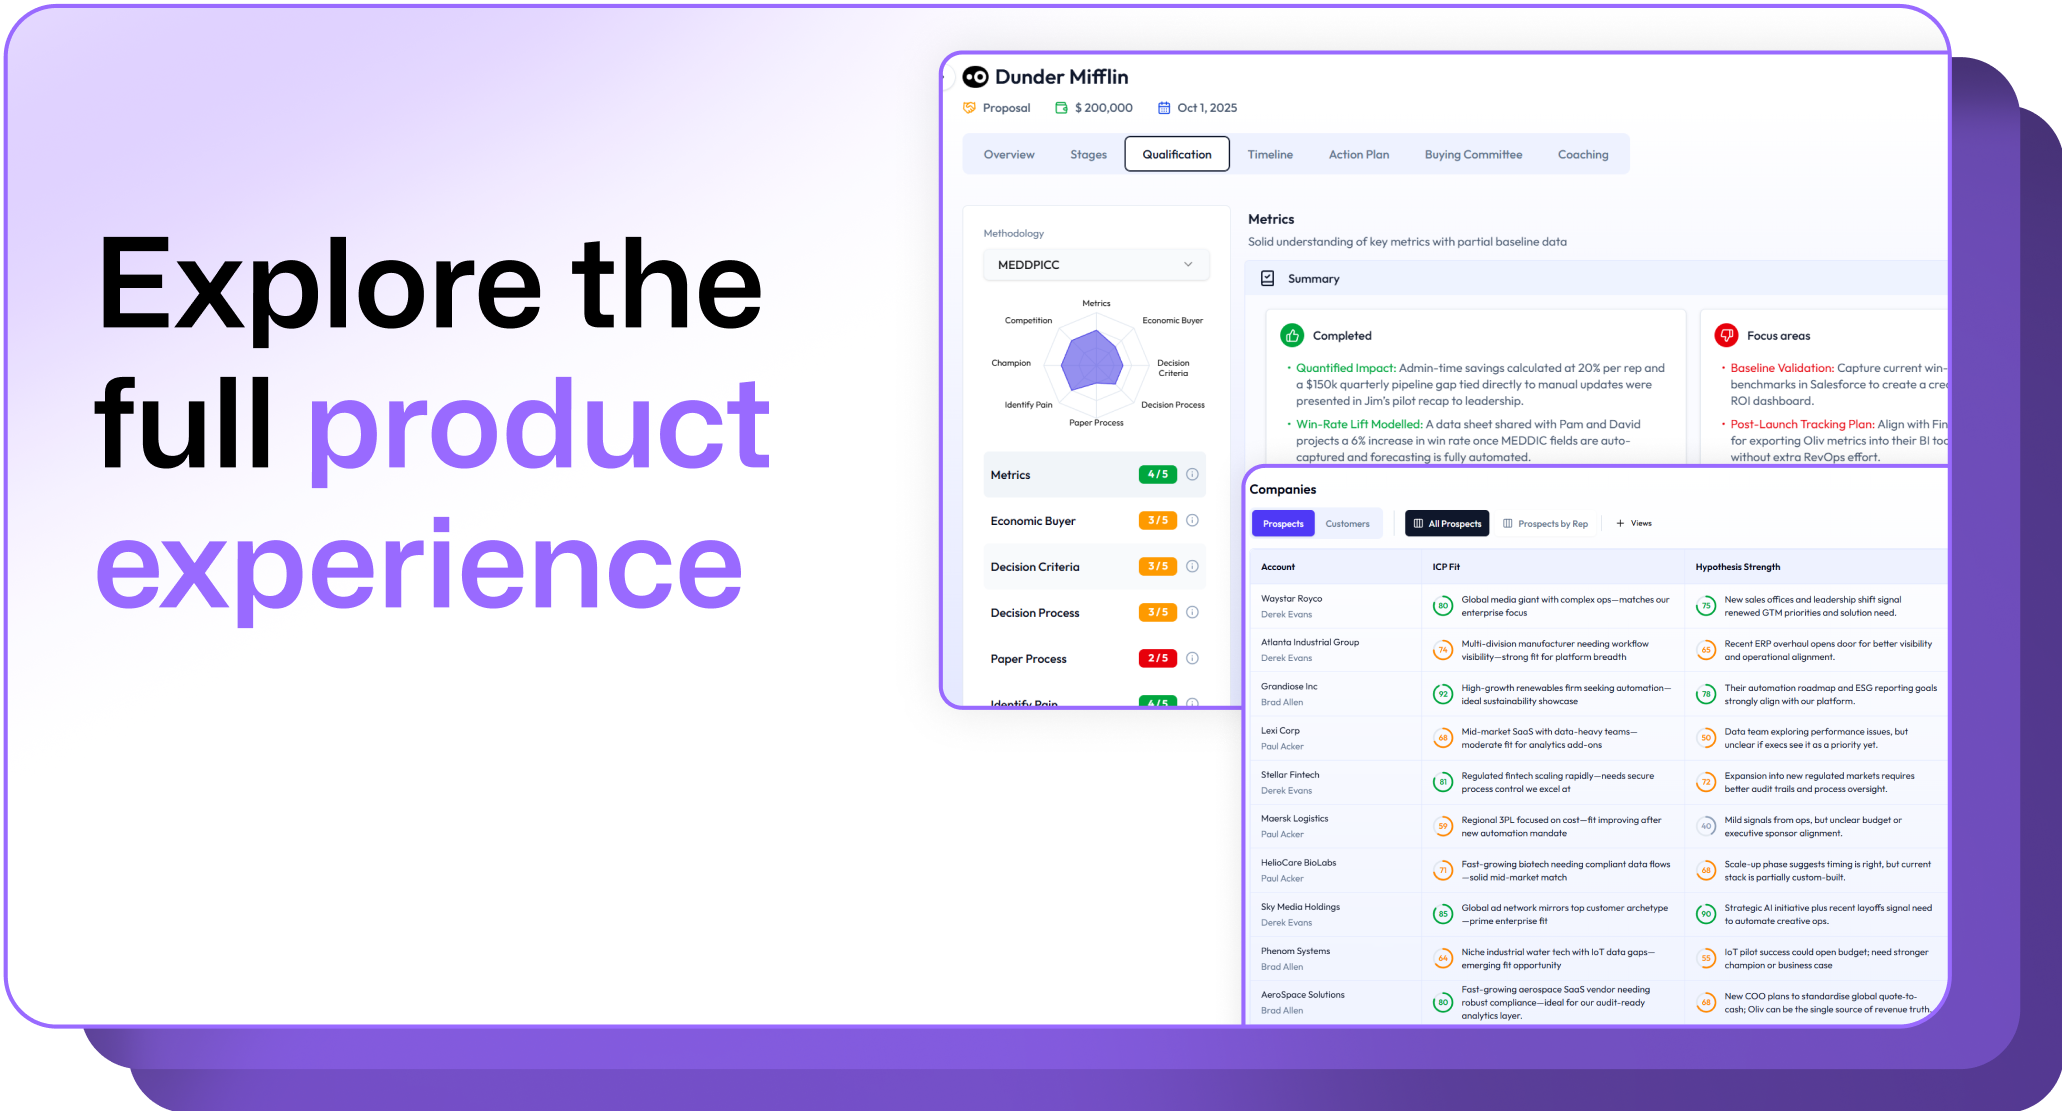
.avif)
.png)
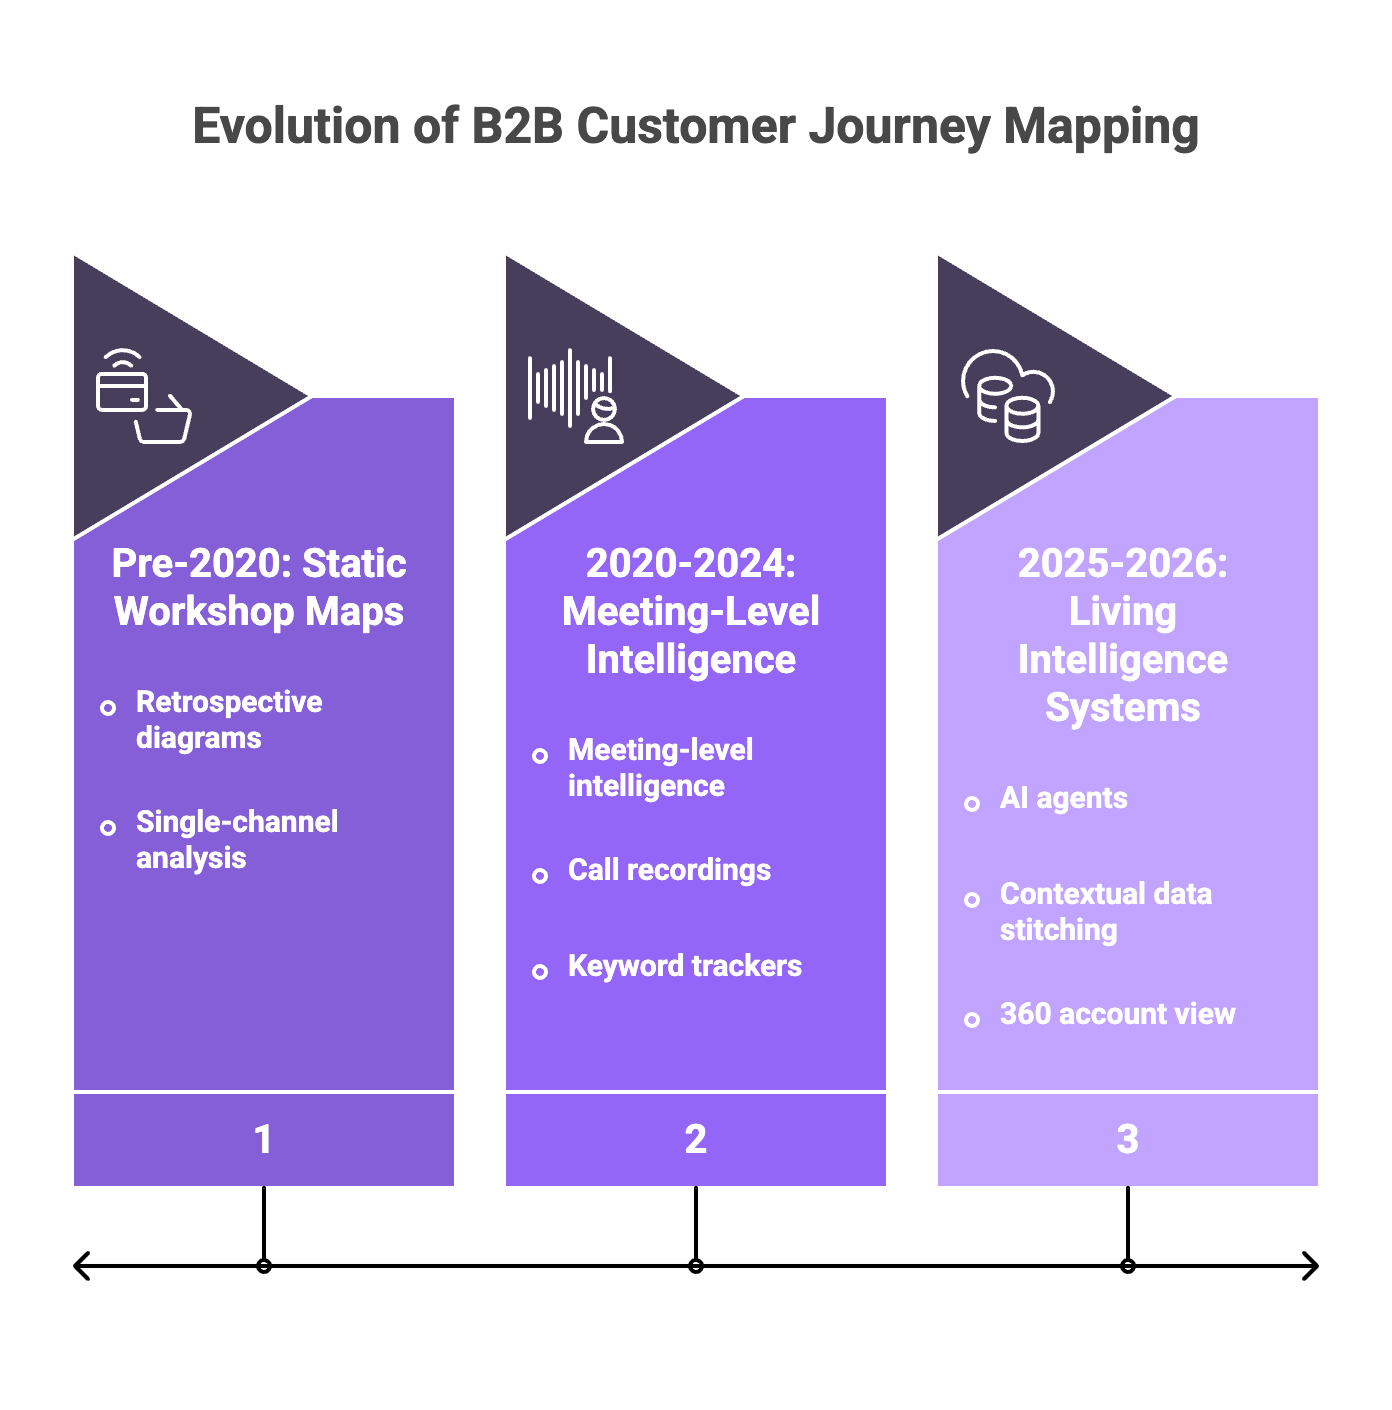
.png)
.png)

.png)
.png)
.png)
.png)

